. 2014 Feb 28;3(1):e000772.
doi: 10.1161/JAHA.113.000772.

Splenectomy is modifying the vascular remodeling of thrombosis

Affiliations

Splenectomy is modifying the vascular remodeling of thrombosis

Maria K Frey et al. J Am Heart Assoc. .

Abstract

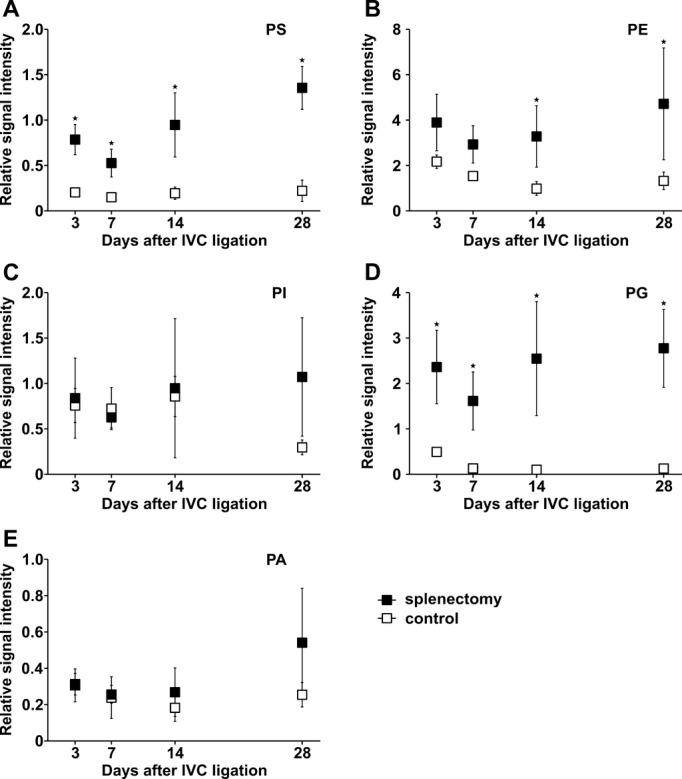
Background: Splenectomy is a clinical risk factor for complicated thrombosis. We hypothesized that the loss of the mechanical filtering function of the spleen may enrich for thrombogenic phospholipids in the circulation, thereby affecting the vascular remodeling of thrombosis.

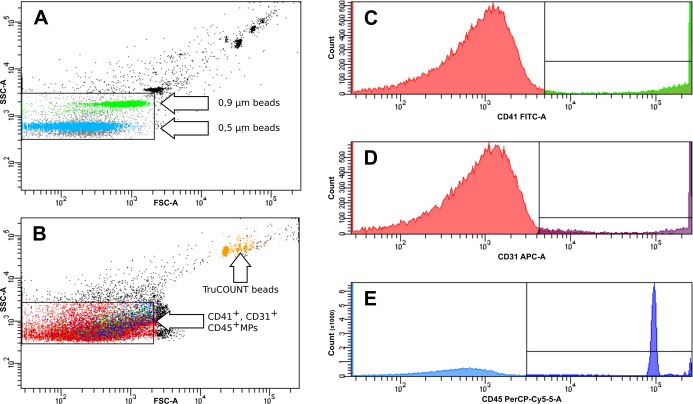
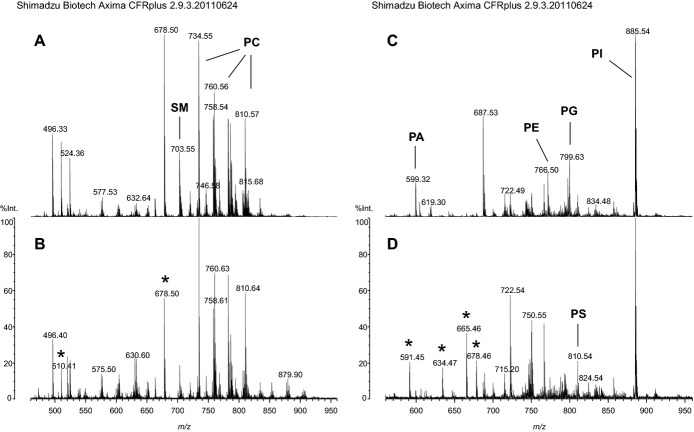
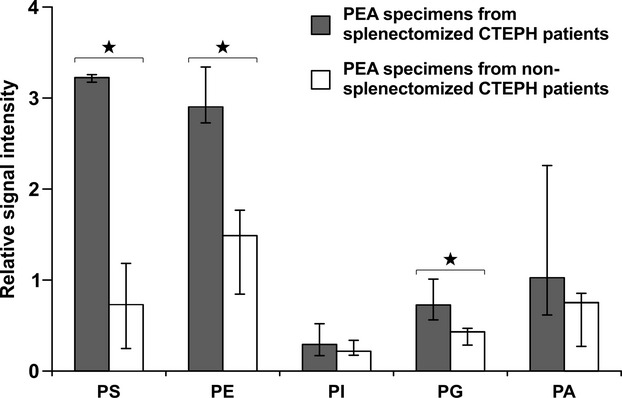
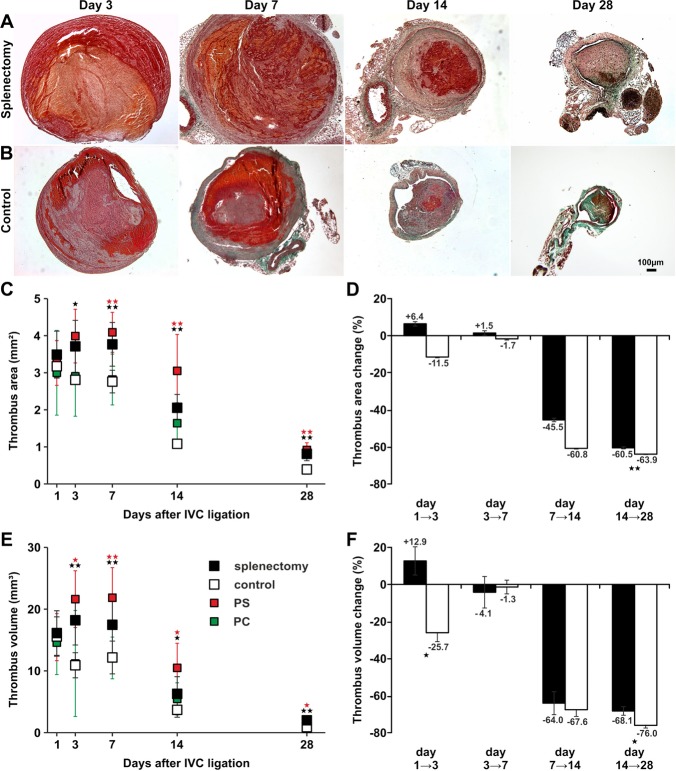
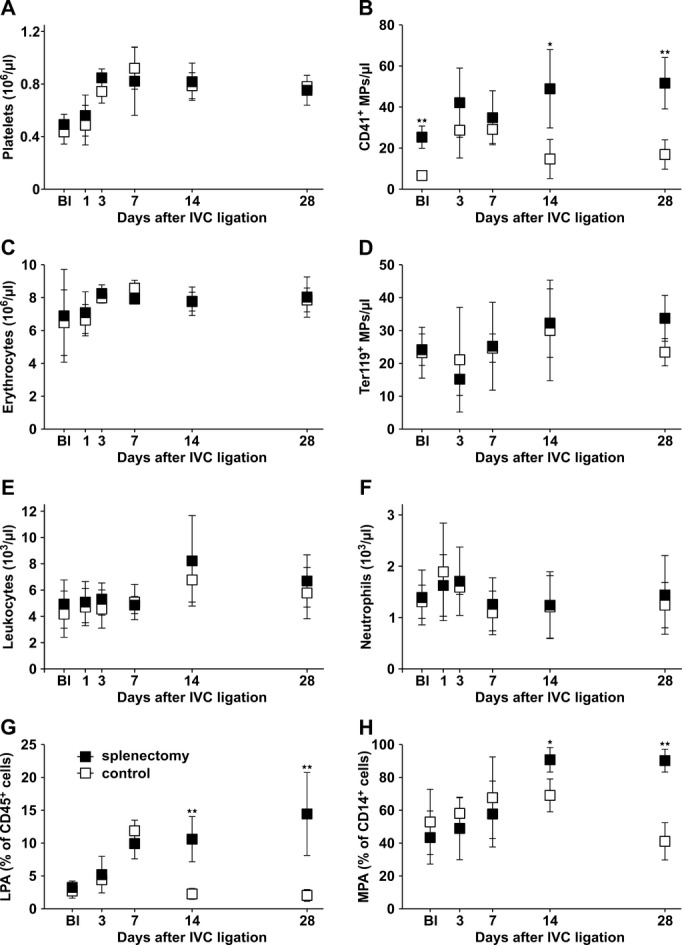
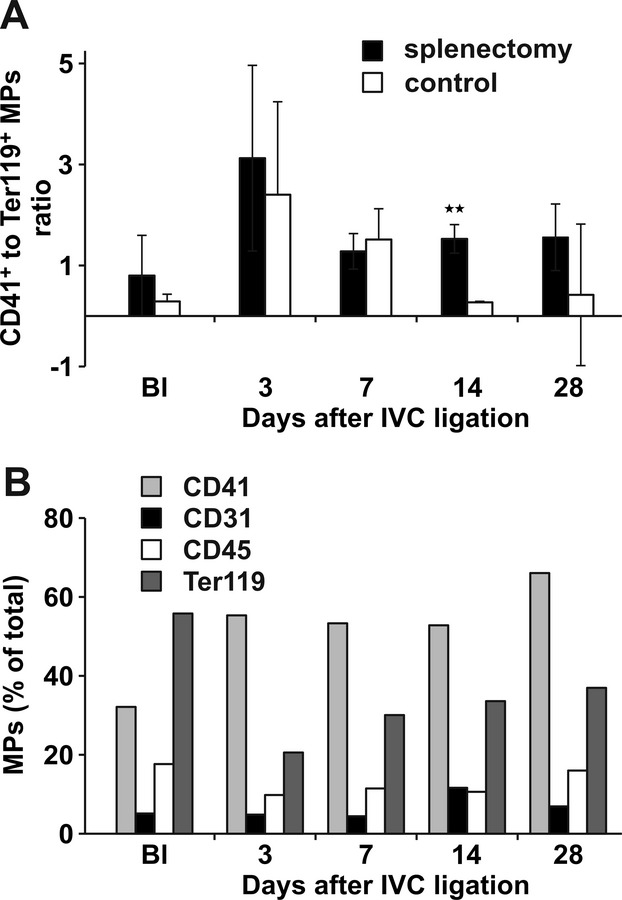
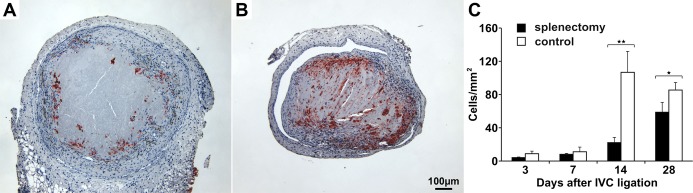
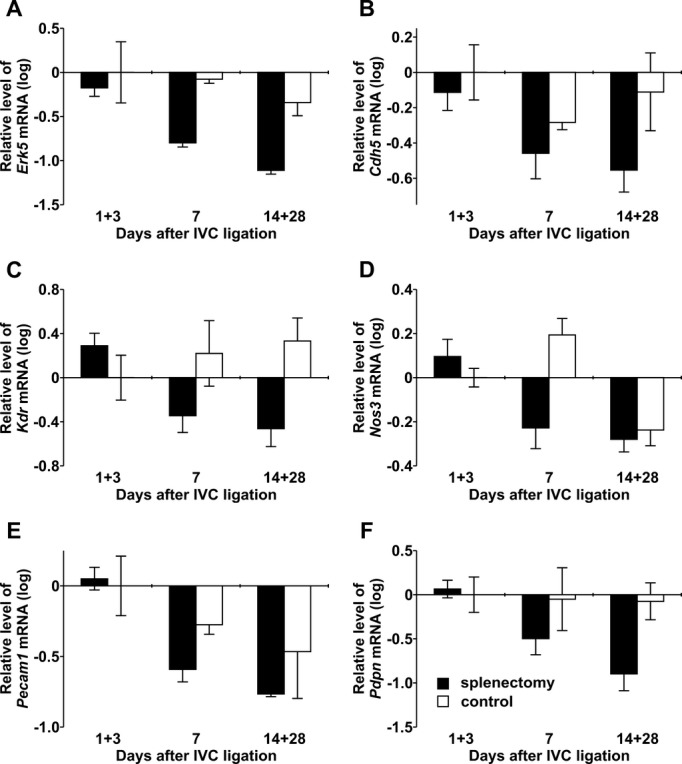
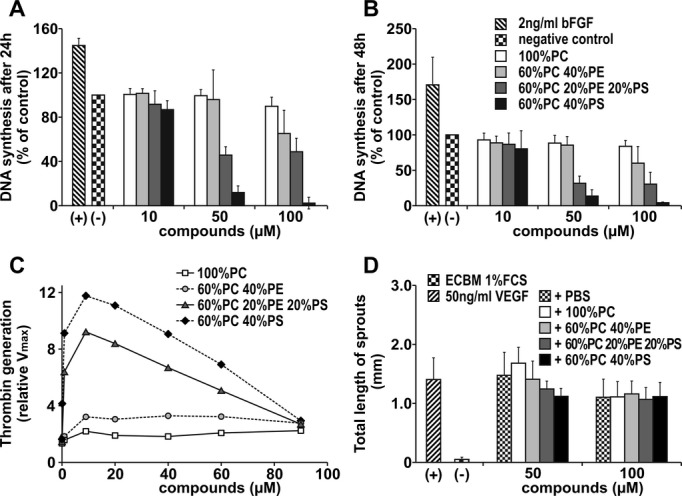
Methods and results: We investigated the effects of splenectomy both in chronic thromboembolic pulmonary hypertension (CTEPH), a human model disease for thrombus nonresolution, and in a mouse model of stagnant flow venous thrombosis mimicking deep vein thrombosis. Surgically excised thrombi from rare cases of CTEPH patients who had undergone previous splenectomy were enriched for anionic phospholipids like phosphatidylserine. Similar to human thrombi, phosphatidylserine accumulated in thrombi after splenectomy in the mouse model. A postsplenectomy state was associated with larger and more persistent thrombi. Higher counts of procoagulant platelet microparticles and increased leukocyte-platelet aggregates were observed in mice after splenectomy. Histological inspection revealed a decreased number of thrombus vessels. Phosphatidylserine-enriched phospholipids specifically inhibited endothelial proliferation and sprouting.

Conclusions: After splenectomy, an increase in circulating microparticles and negatively charged phospholipids is enhanced by experimental thrombus induction. The initial increase in thrombus volume after splenectomy is due to platelet activation, and the subsequent delay of thrombus resolution is due to inhibition of thrombus angiogenesis. The data illustrate a potential mechanism of disease in CTEPH.

Keywords: angiogenesis; hypertension; spectroscopy; venous thrombosis.


Figures

Figure 1.
Figure 1.
Representative flow cytometry density plots showing the gating protocol for microparticles (MPs). The gate of MPs was defined by the use of Megamix beads (Biocytex) containing fluorescent latex microbeads (0.5 and 0.9 μm). TruCOUNT tubes (BD Biosciences) preloaded with a known quantity of fluorescent bead standards were used to calculate absolute numbers of MPs (orange) (A). Representative density plot of detection of CD41+ (platelet derived, green), CD31+ (endothelial derived, violet), and CD45+ (leukocyte derived, blue) MPs using the MP gate defined in A (B). Representative fluorescence histograms showing detection of CD41+ (C), CD31+ (D), and CD45+ (E) MPs. All experiments were repeated 3 times. APC‐A indicates allophycocyanin; FITC, fluorescein isothiocyanate; PerCP, Peridin chlorophyll protein complex; SSC Side Scatter; FSC, Forward Scatter.
Figure 2.
Figure 2.
Raw data from MALDI‐MS analysis of lipid extracts of murine thrombi harvested 14 days after IVC ligation. Mass spectra of splenectomized (A) and sham‐operated mice (controls) (B) recorded in positive mode showing the composition of cationic phospholipids and of splenectomized mice (C) and controls (D) recorded in negative mode showing the composition of anionic phospholipids are displayed. The peaks of most abundant phospholipid species of the different phospholipid classes are indicated, and peaks of the synthetic phospholipid standards added for quantitative evaluation are highlighted by asterisks. IVC indicates inferior vena cava; MALDI matrix‐assisted laser desorption/ionization; PA, phosphatidic acid; PC, phosphatidylcholine; PE, phosphatidylethanolamine, PG, phosphatidylglycerol; PI, phosphatidylinositol; PS, phosphatidylserine; SM, sphingomyelin.
Figure 3.
Figure 3.
Phospholipid profiles of human pulmonary endarterectomy specimens. Phosphatidylserine (PS), phosphatidylethanolamine (PE), phosphatidylinositol (PI) phosphatidylglycerine (PG), and phosphatidic acid (PA) signal intensity is expressed as a ratio between signal intensity of the respective phospholipid and the sum of the signal intensities of the cationic phospholipids phosphatidylcholine (PC) and sphingomyelin (SM) in surgical material of splenectomized (black bars) and nonsplenectomized (open bars) CTEPH patients. Values represent medians and ranges (3 splenectomized CTEPH patients, 4 nonsplenectomized CTEPH patients). *P<0.05. CTEPH indicates chronic thromboembolic pulmonary hypertension; IVC, inferior vena cava; PEA, pulmonary endarterectomy.
Figure 4.
Figure 4.
Remodeling of vascular thrombosis in a mouse model of stagnant flow venous thrombosis. Trichrome stains of thrombi harvested on days 3, 7, 14, and 28 after IVC ligation in mice after splenectomy (A) and in controls (B). Representative results from 8 independent experiments per time point and study group are shown. Bar represents 100 μm. Cross‐sectional area (C), relative area change (D), volume (E), and relative volume change (F) of thrombi after splenectomy (closed symbols), of control thrombi (open symbols), after intravenous injection of PS (red symbols), and after injection of PC (green symbols) at defined time points after IVC ligation. All values represent the mean±SD (n=8). *P<0.05, **P<0.03 by t test comparing means between thrombi of splenectomized mice and controls (black asterisks) and between thrombi after PS injection and controls (red asterisks). Data points were not connected because every data point represents 8 animals that were killed. IVC indicates inferior vena cava; PC, phosphatidylcholine; PS, phosphatidylserine.
Figure 5.
Figure 5.
Circulating cell counts and MP counts in whole blood of splenectomized mice and controls. Platelet counts (A) and platelet MPs (CD41+) (B), erythrocyte counts (C), erythrocyte MPs (Ter119+) (D), leukocytes (E), neutrophils (F), leukocyte–platelet aggregates (LPAs, CD45+CD41+CD62P+ cells) (G), and monocyte–platelet aggregates (MPAs; CD45+CD14+CD41+CD62P+ cells) (H) in whole blood of mice after splenectomy (closed symbols) and controls (open symbols) at defined time points after IVC ligation. Bl indicates values at baseline before IVC ligation 1 month after splenectomy or sham‐splenectomy respectively (A through H). All values represent means±SD (n=8). *P<0.05, **P<0.03. IVC indicates inferior vena cava; MP, microparticles.
Figure 6.
Figure 6.
Characteristics of circulating mouse microparticles (MPs). Ratios of platelet MPs (CD41+) to erythrocyte MPs (Ter119+) detected by FACS in whole blood of mice after splenectomy (filled bars) and controls (open bars). Bl indicates values at baseline before IVC ligation. *P<0.05, **P<0.03 (A). Distribution of cell‐derived MPs in whole blood of splenectomized mice (B). Bl indicates values at baseline before IVC ligation. *P<0.05, **P<0.03. FACS indicates fluorescence‐activated cell sorting; IVC, inferior vena cava.
Figure 7.
Figure 7.
Phospholipid profiles of mouse thrombi. Phosphatidylserine (PS) (A), phosphatidylethanolamine (PE) (B), phosphatidylinositol (PI) (C), phosphatidylglycerine (PG) (D), and phosphatidic acid (PA) (E) signal intensity expressed as ratio between signal intensity of the respective phospholipid and the sum of the signal intensities of the cationic phospholipids phosphatidylcholine (PC) and sphingomyelin (SM) in thrombus homogenates of splenectomized mice (closed symbols) and controls (open symbols) at defined time points after IVC ligation. All values represent means±SD (n=8). *P<0.05. IVC indicates inferior vena cava.
Figure 8.
Figure 8.
Lectin immunoreactivity as a marker for microvessel density in mouse thrombi. Isolectin B4+ (IB4+) cells in a representative thrombus after splenectomy (A) and in a control thrombus (B) 14 days after IVC ligation. Channels lined with IB4+ cells were more frequent in control thrombi than in thrombi after splenectomy. Bar represents 100 μm. Quantification of thrombus IB4+ cells in splenectomized mice (filled bars) and controls (open bars) (C). All values represent means±SD (n=8). *P<0.05, **P<0.03. IVC indicates inferior vena cava.
Figure 9.
Figure 9.
Angiogenesis‐related gene expression in mouse thrombi. mRNA levels for Erk5 (A), VE‐Cadherin (Cdh5) (B), Kdr (C), Nos3 (D), Pecam1 (E), and podoplanin (Pdpn) (F) determined by real‐time PCR in thrombi of splenectomized animals (filled bars) and controls (open bars) at defined days after IVC ligation. IVC indicates inferior vena cava; PCR, polymerase chain reaction.
Figure 10.
Figure 10.
Effect of phospholipids on endothelial cell proliferation. Effect of phospholipids on HUVEC proliferation was evaluated in a BrdU assay. Bars illustrate DNA synthesis rates after incubation with different concentrations of phospholipid mixtures after 24 hours (A) and 48 hours (B). Values determined in the absence of any additions were set at 100% (control). Thrombin generation rates of different phospholipid mixtures were measured with chromogenic substrate S2238, together with components of the prothrombinase complex. Values determined in the presence of buffer alone were set at 1 (control) (C). Angiogenic potential of various phospholipid mixtures was measured in the spheroid assay. Spheroids were treated with 50 ng/mL VEGF together with the compounds for 48 hours. Bars illustrate mean total length of sprouts of a spheroid (D). Assays were repeated 3 times and performed in triplicate. All values represent means±SD. Groups were statistically different (ANOVA, P<0.05) except those after treatment with 100 μmol/L phospholipids in Figure 10D. ECBM indicates endothelial cell basal medium; HUVEC, human umbilical vein endothelial cell; PBS, phosphate‐buffered saline; PC, phosphatidylcholine; PE, phosphatidylethanolamine; PS, phosphatidylserine; VEGF, vascular endothelial growth factor.

References

    1. Stamou KM, Toutouzas KG, Kekis PB, Nakos S, Gafou A, Manouras A, Krespis E, Katsaragakis S, Bramis J. Prospective study of the incidence and risk factors of postsplenectomy thrombosis of the portal, mesenteric, and splenic veins. Arch Surg. 2006; 141:663-669 - PubMed
    1. Thomsen RW, Schoonen WM, Farkas DK, Riis A, Fryzek JP, Sorensen HT. Risk of venous thromboembolism in splenectomized patients compared with the general population and appendectomized patients: a 10‐year nationwide cohort study. J Thromb Haemost. 2010; 8:1413-1416 - PubMed
    1. Lang IM, Klepetko W. Chronic thromboembolic pulmonary hypertension: an updated review. Curr Opin Cardiol. 2008; 23:555-559 - PubMed
    1. Bonderman D, Jakowitsch J, Adlbrecht C, Schemper M, Kyrle PA, Schonauer V, Exner M, Klepetko W, Kneussl MP, Maurer G, Lang I. Medical conditions increasing the risk of chronic thromboembolic pulmonary hypertension. Thromb Haemost. 2005; 93:512-516 - PubMed
    1. Bonderman D, Wilkens H, Wakounig S, Schafers HJ, Jansa P, Lindner J, Simkova I, Martischnig AM, Dudczak J, Sadushi R, Skoro‐Sajer N, Klepetko W, Lang I. Risk factors for chronic thromboembolic pulmonary hypertension. Eur Respir J. 2009; 33:325-331 - PubMed

Publication types

MeSH terms

Substances

LinkOut - more resources