

Steroid receptor coactivator-3 regulates glucose metabolism in bladder cancer cells through coactivation of hypoxia inducible factor 1α
- PMID: 24584933
- PMCID: PMC4036260
- DOI: 10.1074/jbc.M113.535989
Steroid receptor coactivator-3 regulates glucose metabolism in bladder cancer cells through coactivation of hypoxia inducible factor 1α
Abstract
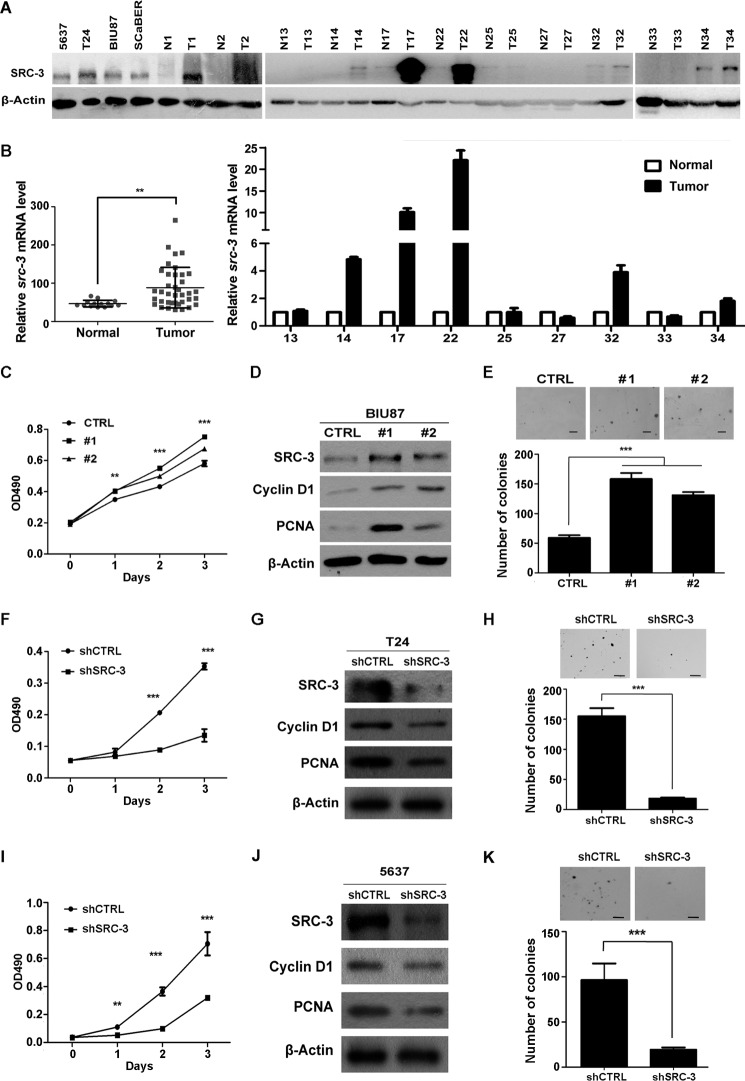
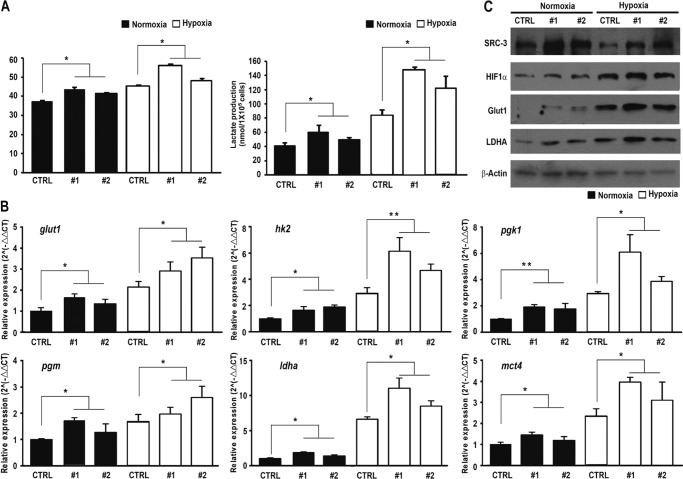
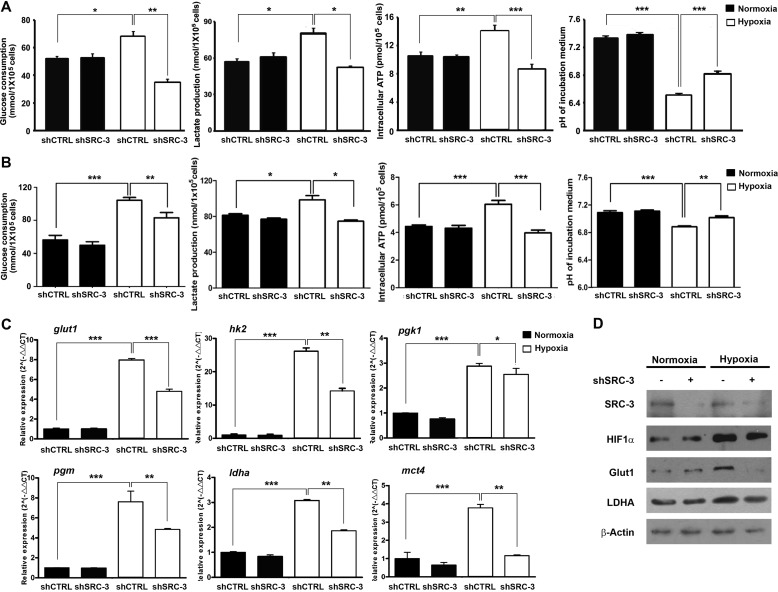
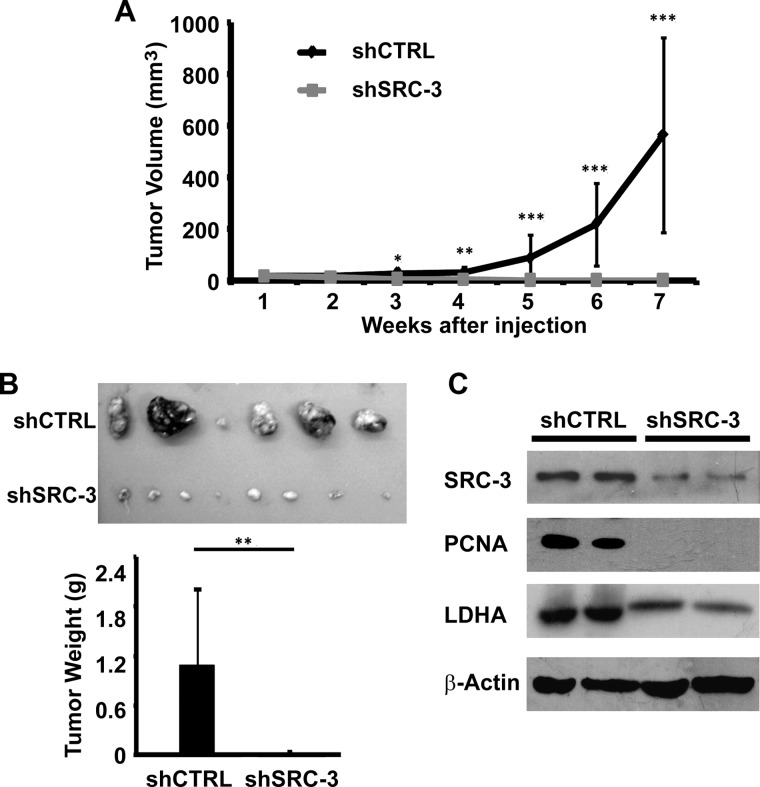
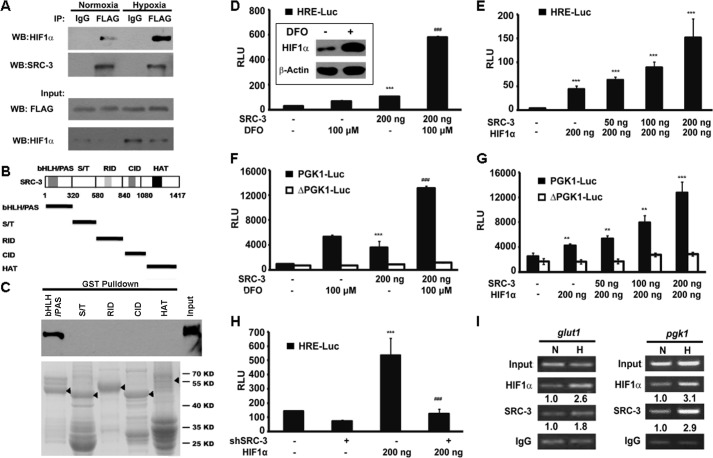
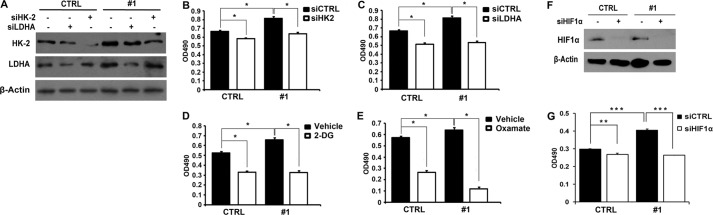
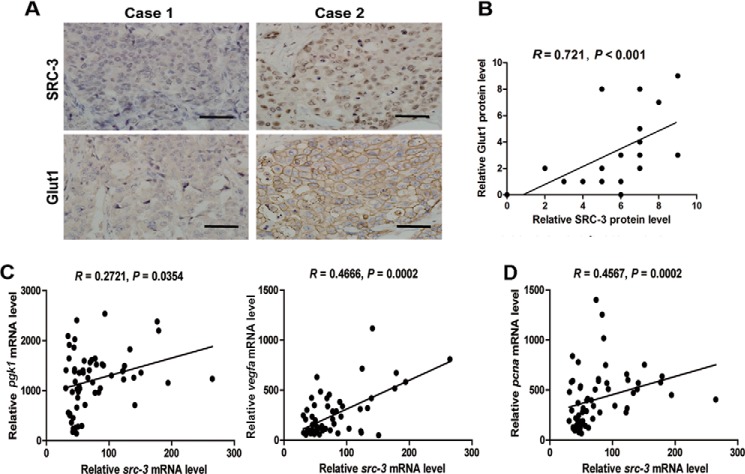
Cancer cell proliferation is a metabolically demanding process, requiring high glycolysis, which is known as "Warburg effect," to support anabolic growth. Steroid receptor coactivator-3 (SRC-3), a steroid receptor coactivator, is overexpressed and/or amplified in multiple cancer types, including non-steroid targeted cancers, such as urinary bladder cancer (UBC). However, whether SRC-3 regulates the metabolic reprogramming for cancer cell growth is unknown. Here, we reported that overexpression of SRC-3 accelerated UBC cell growth, accompanied by the increased expression of genes involved in glycolysis. Knockdown of SRC-3 reduced the UBC cell glycolytic rate under hypoxia, decreased tumor growth in nude mice, with reduction of proliferating cell nuclear antigen and lactate dehydrogenase expression levels. We further revealed that SRC-3 could interact with hypoxia inducible factor 1α (HIF1α), which is a key transcription factor required for glycolysis, and coactivate its transcriptional activity. SRC-3 was recruited to the promoters of HIF1α-target genes, such as glut1 and pgk1. The positive correlation of expression levels between SRC-3 and Glut1 proteins was demonstrated in human UBC patient samples. Inhibition of glycolysis through targeting HK2 or LDHA decelerated SRC-3 overexpression-induced cell growth. In summary, overexpression of SRC-3 promoted glycolysis in bladder cancer cells through HIF1α to facilitate tumorigenesis, which may be an intriguing drug target for bladder cancer therapy.
Keywords: Cancer; Cell Proliferation; Glycolysis; HIF1α; SRC-3; Transcription Coactivators; Tumor Metabolism; Urinary Bladder Cancer.
Figures
Similar articles
-
Histone methyltransferase SETD1A interacts with HIF1α to enhance glycolysis and promote cancer progression in gastric cancer.Mol Oncol. 2020 Jun;14(6):1397-1409. doi: 10.1002/1878-0261.12689. Epub 2020 Apr 26. Mol Oncol. 2020. PMID: 32291851 Free PMC article.
-
Histone demethylase JMJD1A promotes urinary bladder cancer progression by enhancing glycolysis through coactivation of hypoxia inducible factor 1α.Oncogene. 2017 Jul 6;36(27):3868-3877. doi: 10.1038/onc.2017.13. Epub 2017 Mar 6. Oncogene. 2017. PMID: 28263974
-
Metabolic phenotype of bladder cancer.Cancer Treat Rev. 2016 Apr;45:46-57. doi: 10.1016/j.ctrv.2016.03.005. Epub 2016 Mar 8. Cancer Treat Rev. 2016. PMID: 26975021 Review.
-
NRF2 facilitates breast cancer cell growth via HIF1ɑ-mediated metabolic reprogramming.Int J Biochem Cell Biol. 2018 Feb;95:85-92. doi: 10.1016/j.biocel.2017.12.016. Epub 2017 Dec 22. Int J Biochem Cell Biol. 2018. PMID: 29275212
-
HIF-1alpha modulates energy metabolism in cancer cells by inducing over-expression of specific glycolytic isoforms.Mini Rev Med Chem. 2009 Aug;9(9):1084-101. doi: 10.2174/138955709788922610. Mini Rev Med Chem. 2009. PMID: 19689405 Review.
Cited by
-
Monoamine Oxidase A Inhibits Lung Adenocarcinoma Cell Proliferation by Abrogating Aerobic Glycolysis.Front Oncol. 2021 Mar 8;11:645821. doi: 10.3389/fonc.2021.645821. eCollection 2021. Front Oncol. 2021. PMID: 33763378 Free PMC article.
-
Current Development and Application of Anaerobic Glycolytic Enzymes in Urothelial Cancer.Int J Mol Sci. 2021 Sep 30;22(19):10612. doi: 10.3390/ijms221910612. Int J Mol Sci. 2021. PMID: 34638949 Free PMC article. Review.
-
Histone methyltransferase SETD1A interacts with HIF1α to enhance glycolysis and promote cancer progression in gastric cancer.Mol Oncol. 2020 Jun;14(6):1397-1409. doi: 10.1002/1878-0261.12689. Epub 2020 Apr 26. Mol Oncol. 2020. PMID: 32291851 Free PMC article.
-
Honokiol inhibits bladder cancer cell invasion through repressing SRC-3 expression and epithelial-mesenchymal transition.Oncol Lett. 2017 Oct;14(4):4294-4300. doi: 10.3892/ol.2017.6665. Epub 2017 Jul 25. Oncol Lett. 2017. PMID: 28943942 Free PMC article.
-
TGFβ1 Promotes Gemcitabine Resistance through Regulating the LncRNA-LET/NF90/miR-145 Signaling Axis in Bladder Cancer.Theranostics. 2017 Jul 22;7(12):3053-3067. doi: 10.7150/thno.19542. eCollection 2017. Theranostics. 2017. PMID: 28839463 Free PMC article.
References
-
- Hanahan D., Weinberg R. A. (2011) Hallmarks of cancer: the next generation. Cell 144, 646–674 - PubMed
-
- Hsu P. P., Sabatini D. M. (2008) Cancer cell metabolism: Warburg and beyond. Cell 134, 703–707 - PubMed
-
- Denko N. C. (2008) Hypoxia, HIF1 and glucose metabolism in the solid tumour. Nat. Rev. Cancer 8, 705–713 - PubMed
-
- Semenza G. L. (2007) HIF-1 mediates the Warburg effect in clear cell renal carcinoma. J. Bioenerg. Biomembr. 39, 231–234 - PubMed
Publication types
MeSH terms
Substances
LinkOut - more resources
Full Text Sources
Other Literature Sources
Medical
Miscellaneous
