. 2014 Apr 11;289(15):10431-10444.
doi: 10.1074/jbc.M113.541839. Epub 2014 Feb 28.

Association of the breast cancer antiestrogen resistance protein 1 (BCAR1) and BCAR3 scaffolding proteins in cell signaling and antiestrogen resistance

Affiliations

Association of the breast cancer antiestrogen resistance protein 1 (BCAR1) and BCAR3 scaffolding proteins in cell signaling and antiestrogen resistance

Yann Wallez et al. J Biol Chem. .

Abstract

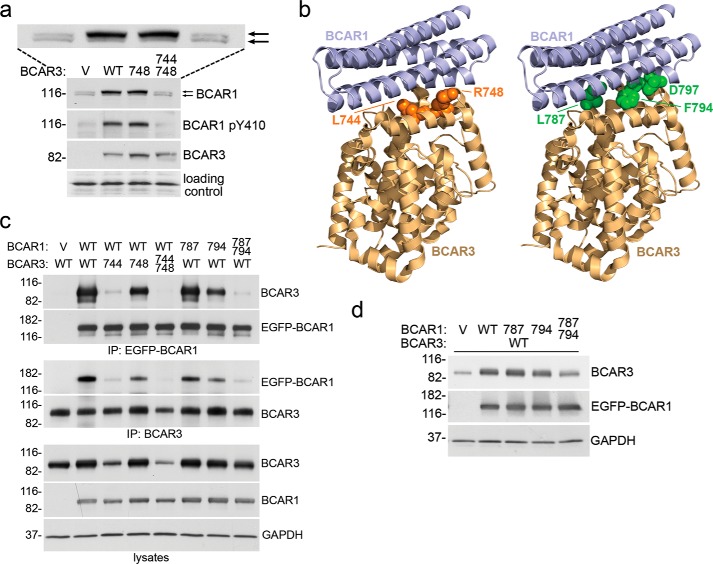
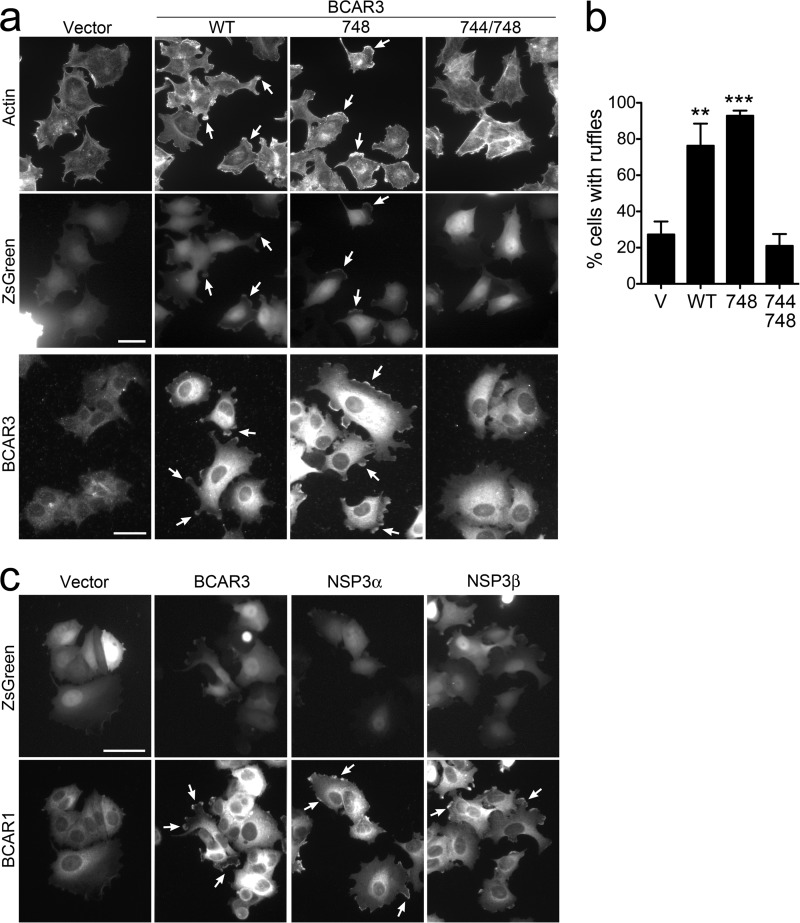
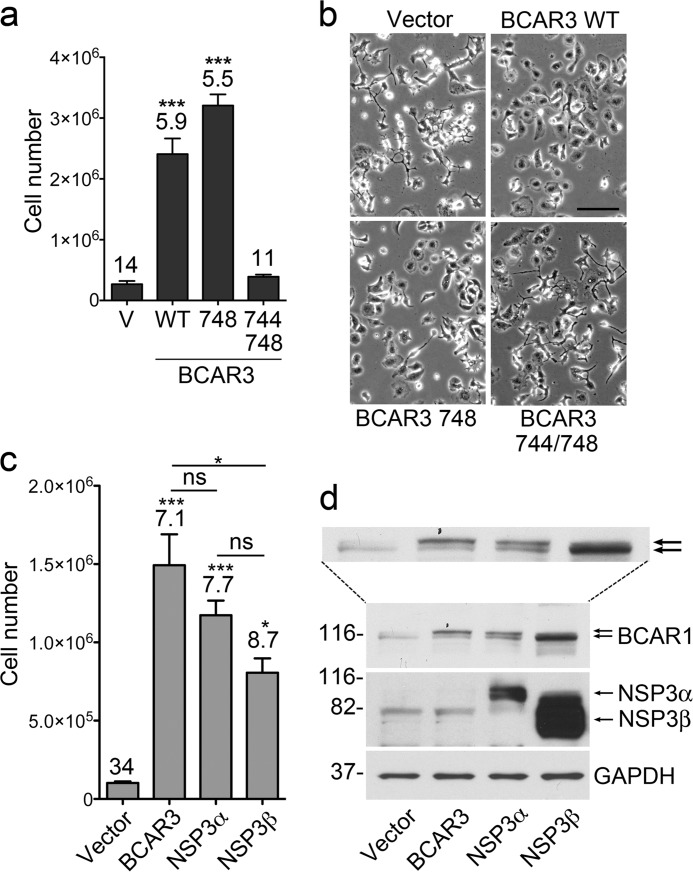
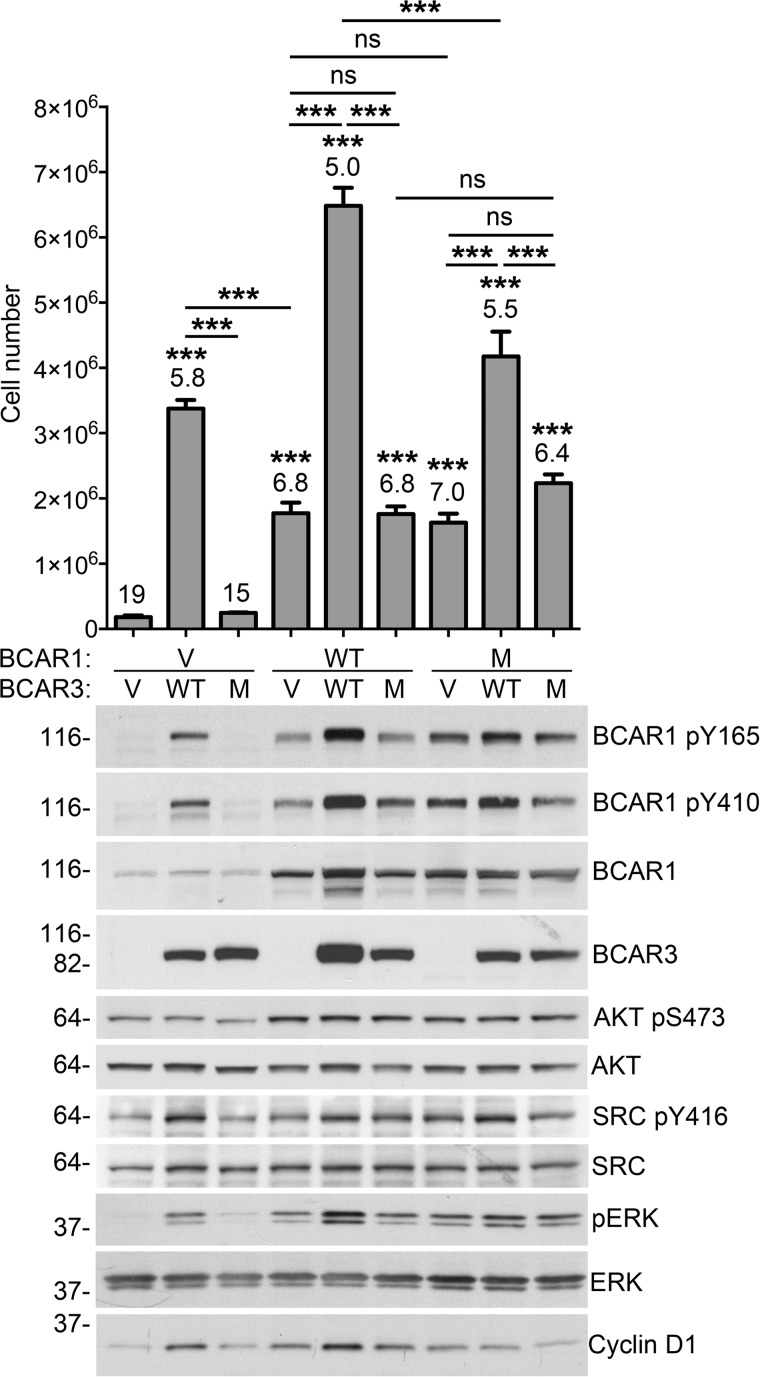
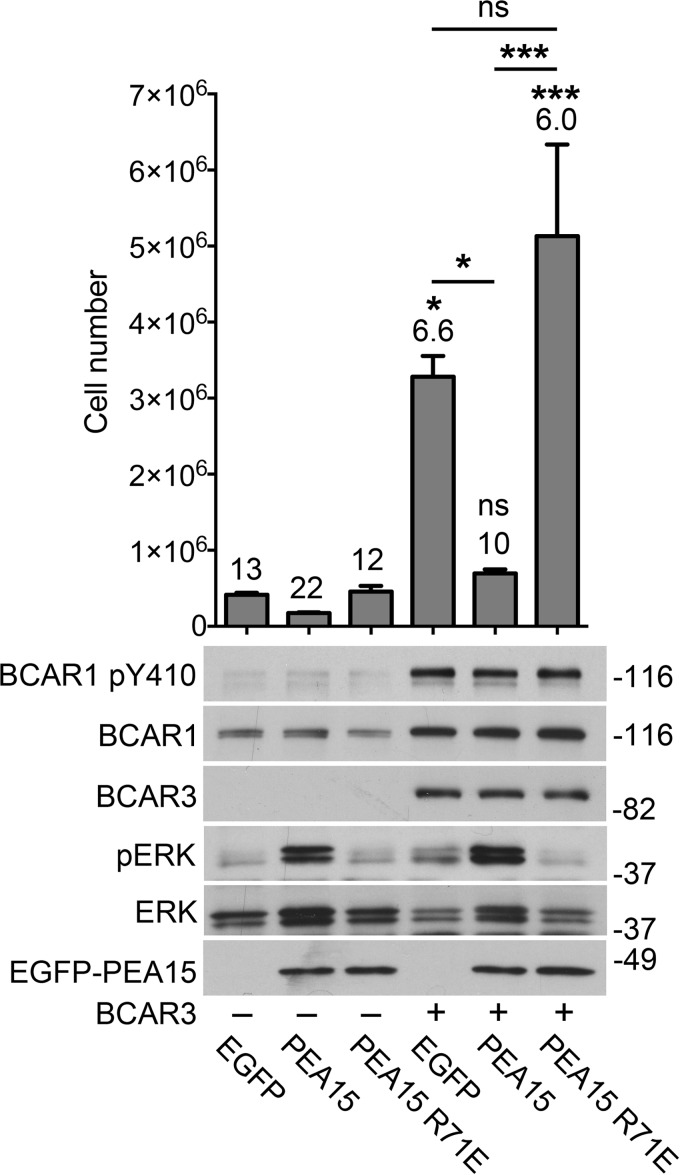
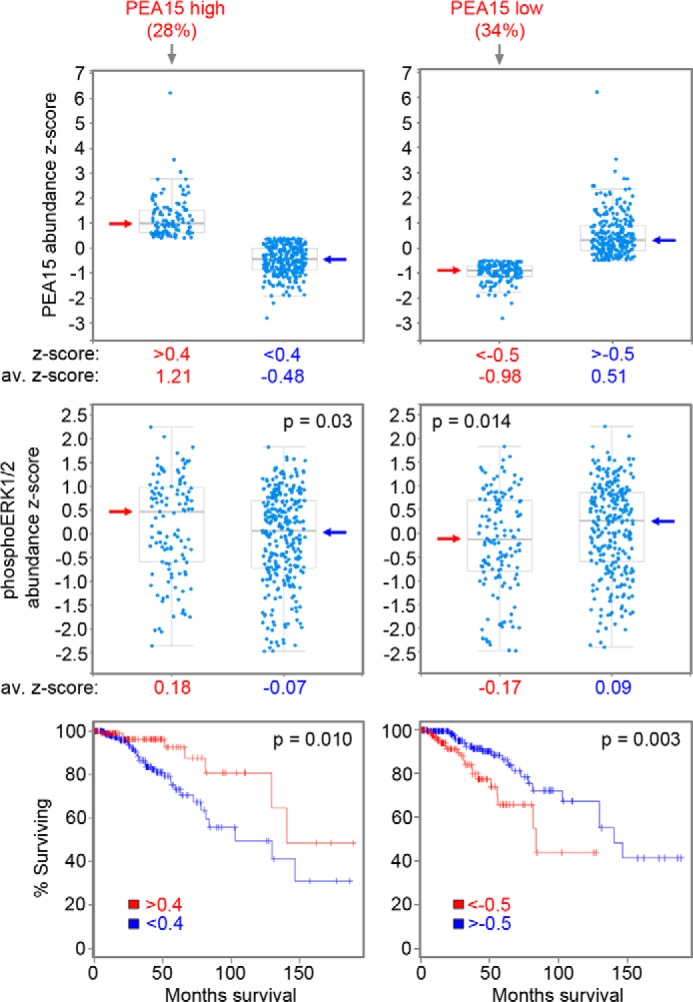
Most breast cancers are estrogen receptor-positive and treated with antiestrogens, but aberrant signaling networks can induce drug resistance. One of these networks involves the scaffolding protein BCAR1/p130CAS, which regulates cell growth and migration/invasion. A less investigated scaffolding protein that also confers antiestrogen resistance is the SH2 domain-containing protein BCAR3. BCAR1 and BCAR3 bind tightly to each other through their C-terminal domains, thus potentially connecting their associated signaling networks. However, recent studies using BCAR1 and BCAR3 interaction mutants concluded that association between the two proteins is not critical for many of their interrelated activities regulating breast cancer malignancy. We report that these previously used BCAR mutations fail to cause adequate loss-of-function of the complex. By using structure-based BCAR1 and BCAR3 mutants that lack the ability to interact, we show that BCAR3-induced antiestrogen resistance in MCF7 breast cancer cells critically depends on its ability to bind BCAR1. Interaction with BCAR3 increases the levels of phosphorylated BCAR1, ultimately potentiating BCAR1-dependent antiestrogen resistance. Furthermore, antiestrogen resistance in cells overexpressing BCAR1/BCAR3 correlates with increased ERK1/2 activity. Inhibiting ERK1/2 through overexpression of the regulatory protein PEA15 negates the resistance, revealing a key role for ERK1/2 in BCAR1/BCAR3-induced antiestrogen resistance. Reverse-phase protein array data show that PEA15 levels in invasive breast cancers correlate with patient survival, suggesting that PEA15 can override ERK1/2 activation by BCAR1/BCAR3 and other upstream regulators. We further uncovered that the BCAR3-related NSP3 can also promote antiestrogen resistance. Thus, strategies to disrupt BCAR1-BCAR3/NSP3 complexes and associated signaling networks could ultimately lead to new breast cancer therapies.

Keywords: Anticancer Drug; Breast Cancer; Cancer; Drug Resistance; ERK1/2; MAP Kinases (MAPKs); Mesenchymal Phenotype; NSP3; PEA15; Protein-Protein Interactions.


Figures

FIGURE 1.
FIGURE 1.
Structure-guided mutation of multiple residues in the binding surfaces of BCAR3 or BCAR1 disrupts their interaction and abrogates crucial signaling events. a, stable lentiviral transduction of BCAR3 wild-type (WT) or the L748E single mutant in MCF7 breast cancer cells similarly increase BCAR1 levels, BCAR1 substrate domain tyrosine phosphorylation (detected with an antibody to phospho-Tyr-410), and the proportion of the hyperphosphorylated BCAR1 upper band (top arrow). An enlargement of the BCAR1 blot is also included to more clearly show the upper and lower BCAR1 bands, which are marked by the two arrows. In contrast, the L744E/R748E double mutant has lost these activities. V, empty lentiviral vector control. Cell lysates were probed by immunoblotting with the indicated antibodies. A band recognized non-specifically by the BCAR1 antibody demonstrates equal loading of the lanes (loading control). b, BCAR1-BCAR3 complex modeled by overlaying the crystal structure of the BCAR3 C-terminal domain (PDB:3T6A) onto the complex structure of the BCAR1 and NSP3 C-terminal domains (PDB ID 3T6G). The two domains are shown in schematic representation, and residues in the binding interfaces that were mutated are shown in sphere representation (left, BCAR3, orange; right, BCAR1, green). c, effects of BCAR1 and BCAR3 mutations on the association between the two proteins as determined by coimmunoprecipitation (IP) from HEK293 cells transfected with the indicated combinations of empty vector controls, EGFP-BCAR1, and BCAR3 wild-type or mutant plasmids. To avoid possible interference with the BCAR1-BCAR3 association by the immunoprecipitating antibody, BCAR1 was immunoprecipitated with an antibody to the EGFP tag (which was also used for detection of EGFP-BCAR1 by immunoblotting), and BCAR3 was immunoprecipitated with an antibody to an epitope near the N terminus. Cell lysates were also probed, revealing low expression of the BCAR3 L744E and L744E/R748E mutants, which is likely due to their impaired interaction with both wild-type and transfected BCAR1. GAPDH was probed as a loading control. Mutations: 744, L744E; 748, R748E; 787, L787E; 794, F794R. d, transient transfection of BCAR1 in HEK293 cells increases the levels of cotransfected wild-type BCAR3 and different mutations in the BCAR3-interacting domain of BCAR1 impair this effect to different extents. Cells were transiently transfected with empty vector control (V) or with a BCAR3 WT plasmid together with BCAR1 wild-type, L787E (787) or F794R (794) single mutants, or the BCAR1 L787E/F794R double mutant. Cell lysates were probed by immunoblotting with the indicated antibodies, with the immunoblot for GAPDH demonstrating equal loading of the lanes.
FIGURE 2.
FIGURE 2.
BCAR3 and the related NSP3 induce formation of membrane ruffles, which requires complex formation with BCAR1. a, MCF7 cell populations stably transduced with lentiviral vectors encoding ZsGreen alone (V) or together with wild-type BCAR3 (WT), the BCAR3 R748E single mutant (748), or the BCAR3 L744E/R748E double mutant (744/748) were stained with phalloidin to label filamentous actin (top row) or with an anti-BCAR3 antibody (bottom row). The phalloidin-stained cells were also imaged for ZsGreen fluorescence to identify the cells expressing BCAR3 and ZsGreen from the bicistronic transcript (middle row). BCAR3 wild-type and the R748E single mutant both promote the formation of membrane ruffles compared with the vector control cells (arrows point to examples of ruffles), whereas the BCAR3 L744E/R748E double mutant does not. Furthermore, BCAR3 immunoreactivity is evident in the ruffles. Scale bars = 25 μm. b, the histogram shows the percentage of ZsGreen-expressing cells that contain ruffles. **, p < 0.01, and ***, p < 0.001 for the comparison with vector control-infected cells by one-way ANOVA and Dunnett's post hoc test. c, overexpression of BCAR3 and NSP3 in MCF7 cells promotes the formation of membrane ruffles containing BCAR1. Levels and subcellular localization of endogenous BCAR1 are shown by immunolabeling (arrows point to examples of ruffles). ZsGreen fluorescence identifies the cells expressing BCAR3 or NSP3 from the bicistronic transcripts. Scale bar = 40 μm.
FIGURE 3.
FIGURE 3.
BCAR3 and the related NSP3 promote antiestrogen resistance, which requires complex formation with BCAR1. a, MCF7 cell populations stably transduced with lentiviral vectors encoding ZsGreen alone (V) or together with wild-type or mutant BCAR3 were grown for 33 days in the presence of the estrogen receptor antagonist ICI182780. The histogram shows the means ± S.E. from triplicate measurements. The doubling time of the cultures (in days) is also shown above the bars. ***, p < 0.001 for the comparison with vector control-infected cells by one way ANOVA and Dunnett's post hoc test. The BCAR3 double mutant, but not the single mutant, has lost the ability to promote antiestrogen resistance. The somewhat higher growth observed in the presence of the BCAR3 R748E single mutant may be due to its slightly higher expression compared with wild-type BCAR3 (see Fig. 1a). b, phase contrast images illustrate the detrimental effects of ICI182780 treatment for 5 days on the morphology of cells transduced with control vector or the BCAR3 double mutant, whereas expression of BCAR3 wild-type and the R748E mutant have a more healthy appearance consistent with their faster proliferation. Scale bar = 100 μm. c, MCF7 breast cancer cell populations stably expressing BCAR3, NSP3α, NSP3β, or vector control were grown for 35 days in the presence of ICI182780. The histogram shows averages from triplicate measurements ± S.E. The doubling time of each cell population, in days, is indicated above each bar. *, p < 0.05, ***, p < 0.001 for the comparisons with control vector-infected cells by one-way ANOVA and Tukey's post hoc test. Other comparisons, indicated by bars, are also shown; ns, not significant. d, lysates of MCF7 breast cancer cell populations stably expressing BCAR3, NSP3α, NSP3β, or vector control were probed by immunoblotting with the indicated antibodies. Although the NSP3 antibody used may recognize better NSP3β than NSP3α (see “Experimental Procedures”), immunoblotting with an NSP3 antibody recognizing the C terminus also indicated that NSP3β was more highly expressed than NSP3α. An enlargement of the BCAR1 blot is also included to more clearly show the upper and lower BCAR1 bands, which are marked by the two arrows. GAPDH was probed as the loading control.
FIGURE 4.
FIGURE 4.
Effects of BCAR1-BCAR3 interaction on antiestrogen resistance and signaling networks. Lentivirally transduced MCF7 breast cancer cell populations expressing BCAR1/BCAR3 WT, the BCAR3 L744E/R748E mutant (M), the BCAR1 L787E/F794E/D797R mutant (M), or the appropriate control lentiviral vectors (V) were grown for 35 days in the presence of ICI182780. The histogram shows averages ± S.E. from triplicate measurements. The doubling time of each cell population, in days, is indicated above each bar. The doubling time of the parental cells in the absence of ICI182780 was 2 days. ***, p < 0.001 for the comparisons with control vector-infected cells by one-way ANOVA and Tukey's post hoc test. Other comparisons, indicated by bars, are also shown; ns, not significant. In the immunoblots, lysates from cells treated with ICI182780 for 8 days were probed with the indicated antibodies.
FIGURE 5.
FIGURE 5.
BCAR1/BCAR3-induced antiestrogen resistance requires ERK1/2 activity. MCF7 cell populations with or without stable BCAR3 lentiviral expression were infected with lentiviruses encoding EGFP alone or fused to PEA15 wild-type or the PEA15 R71E mutant. The cells were then grown for 39 days in the presence of ICI182780. The histogram shows average cell numbers from triplicate measurements ± S.E. The doubling time of each cell population, in days, is indicated above each bar. *, p < 0.05; ***, p < 0.001; ns, not significant for the comparison with the EGFP-expressing control cells (first lane) by one-way ANOVA and Tukey's post hoc test. Other comparisons, indicated by bars, are also shown. The immunoblots show lysates from cells treated with ICI182780 for 4 days and probed with the indicated antibodies. PEA15 counteracts estrogen-independent growth induced by BCAR3 overexpression in MCF7 cells.
FIGURE 6.
FIGURE 6.
PEA15 expression levels in invasive breast cancers correlate with ERK1/2 phosphorylation and patient overall survival. A cohort of 408 tumors with large scale reverse phase protein array data from a TCGA provisional invasive breast cancer study was analyzed. Top left, Boxplot representation of the group including the 28% of the tumors with highest PEA15 expression (abundance z-score >0.4, average abundance z-score = 1.21) and the group including the remaining 72% of the tumors (abundance z-score <0.4, average z-score = −0.48). Middle left, Boxplot representation of ERK1/2 phospho-Thr-202 levels in the tumors with highest PEA15 expression (average phospho-ERK1/2 abundance z-score = 0.18) versus the remaining tumors (average phospho-ERK1/2 abundance z-score = −0.07, p = 0.03 for the difference in phospho-ERK1/2 levels by two-sided, two-sample Student's t test). Bottom left, patients with tumors expressing the highest levels of PEA15 survived significantly longer than the remaining patients (Kaplan-Meier plot, p = 0.010 by log-rank test) despite their higher phospho-ERK1/2 levels. Top right, Boxplot representation of the group including the 34% of the tumors with lowest PEA15 expression (abundance z-score <-0.5, average z-score = −0.98) and the group including the remaining 66% of the tumors (abundance z-score >-0.5, average z-score = 0.51). Middle right, Boxplot representation of phospho-ERK1/2 levels in the tumors with the lowest PEA15 expression (average ERK1/2 phospho-Thr-202 abundance z-score = −0.17) versus the remaining tumors (average phospho-ERK1/2 abundance z-score = 0.09, p = 0.014 for the difference in phospho-ERK1/2 levels by two-sided, two-sample Student's t test). Bottom right, patients with tumors expressing the lowest levels of PEA15 survived significantly less than the remaining patients (Kaplan-Meier plot, p = 0.003 by log-rank test) despite their lower phospho-ERK1/2 levels. Arrows in the boxplots mark the median values.

Similar articles

Cited by

References

    1. Riggins R. B., Schrecengost R. S., Guerrero M. S., Bouton A. H. (2007) Pathways to tamoxifen resistance. Cancer letters 256, 1–24 - PMC - PubMed
    1. Musgrove E. A., Sutherland R. L. (2009) Biological determinants of endocrine resistance in breast cancer. Nat. Rev. Cancer 9, 631–643 - PubMed
    1. Brinkman A., van der Flier S., Kok E. M., Dorssers L. C. (2000) BCAR1, a human homologue of the adapter protein p130Cas, and antiestrogen resistance in breast cancer cells. J. Natl. Cancer Inst. 92, 112–120 - PubMed
    1. van der Flier S., Chan C. M., Brinkman A., Smid M., Johnston S. R., Dorssers L. C., Dowsett M. (2000) BCAR1/p130Cas expression in untreated and acquired tamoxifen-resistant human breast carcinomas. Int. J. Cancer 89, 465–468 - PubMed
    1. van der Flier S., Brinkman A., Look M. P., Kok E. M., Meijer-van Gelder M. E., Klijn J. G., Dorssers L. C., Foekens J. A. (2000) Bcar1/p130Cas protein and primary breast cancer. Prognosis and response to tamoxifen treatment. J. Natl. Cancer Inst. 92, 120–127 - PubMed

Publication types

MeSH terms

Substances