. 2014 May;44(5):1661-8.
doi: 10.3892/ijo.2014.2313. Epub 2014 Feb 27.

Spautin-1, a novel autophagy inhibitor, enhances imatinib-induced apoptosis in chronic myeloid leukemia

Affiliations

Spautin-1, a novel autophagy inhibitor, enhances imatinib-induced apoptosis in chronic myeloid leukemia

Shan Shao et al. Int J Oncol. 2014 May.

Abstract

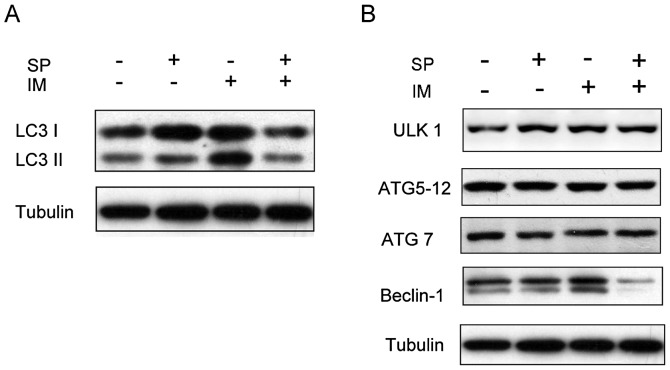
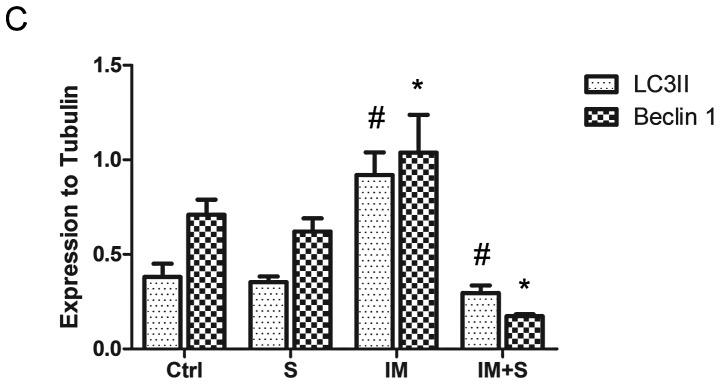
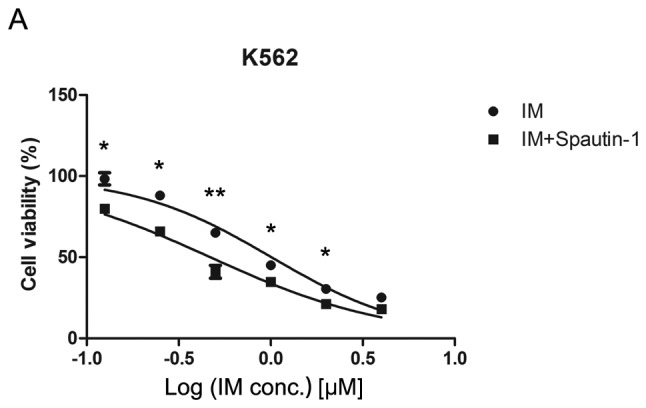
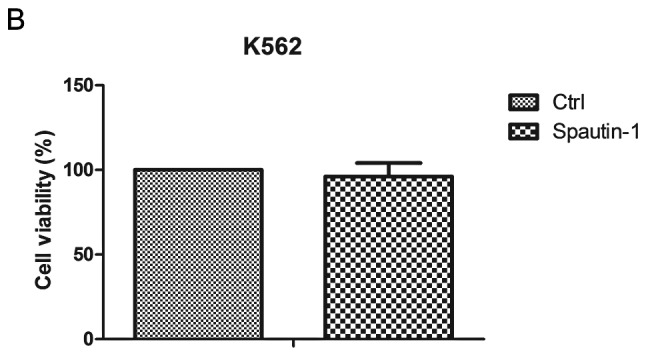
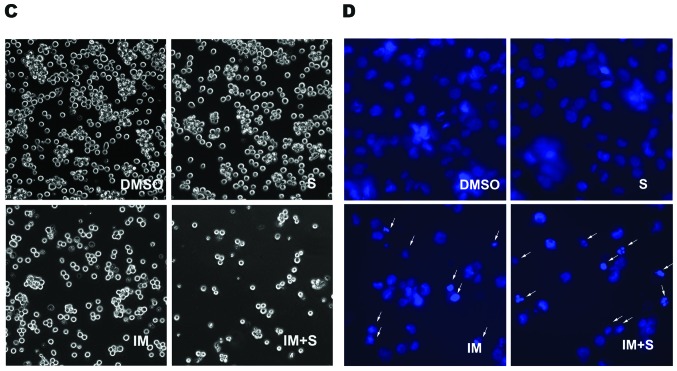
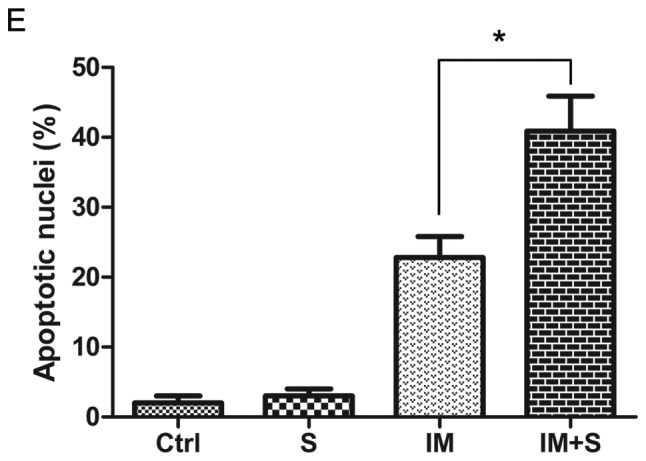
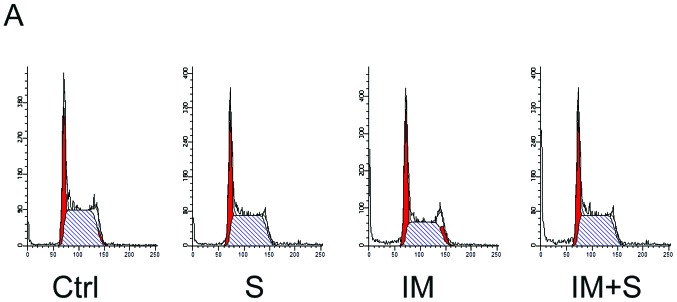
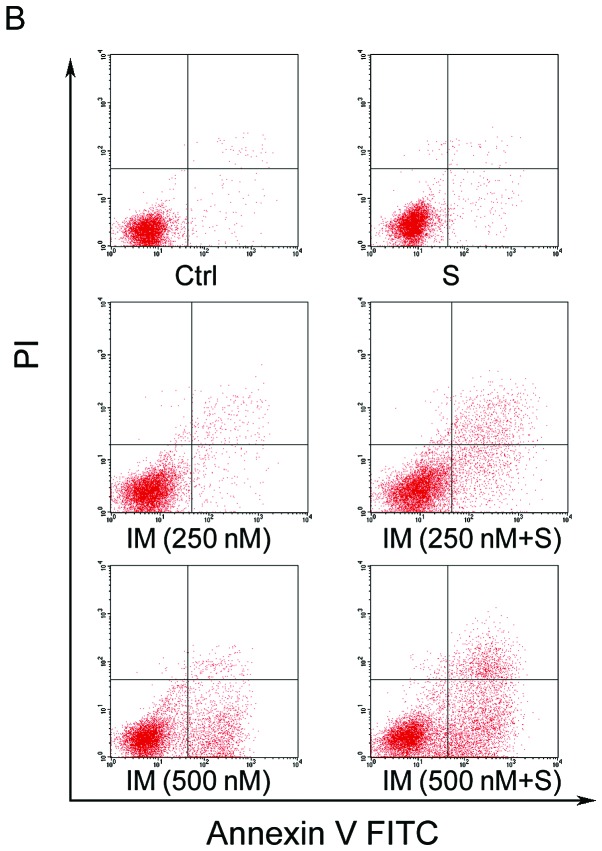
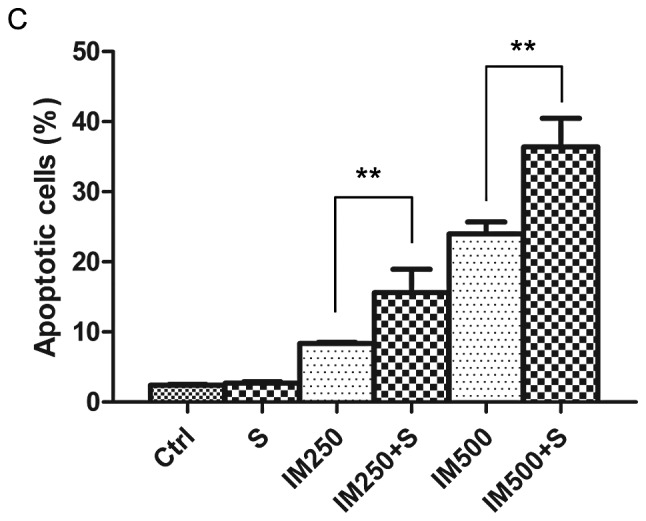
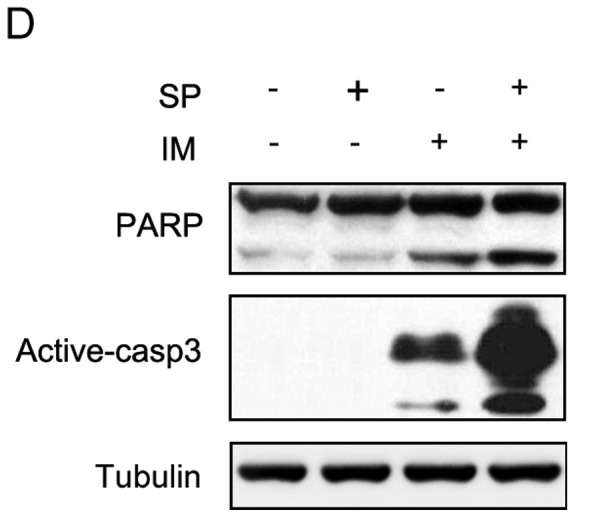
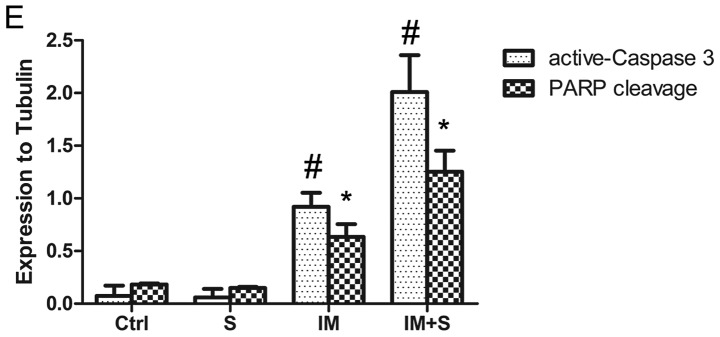
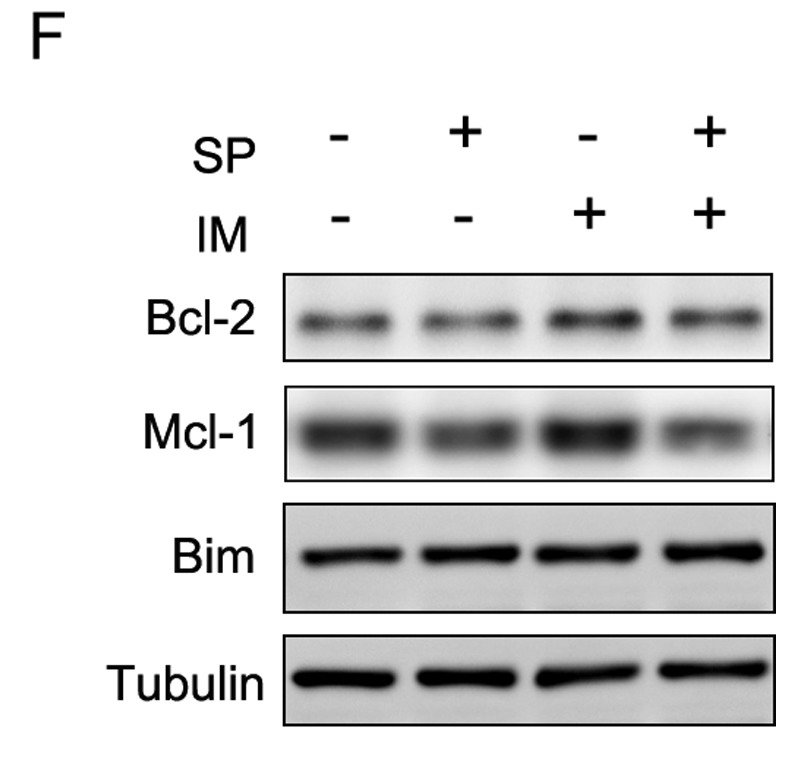
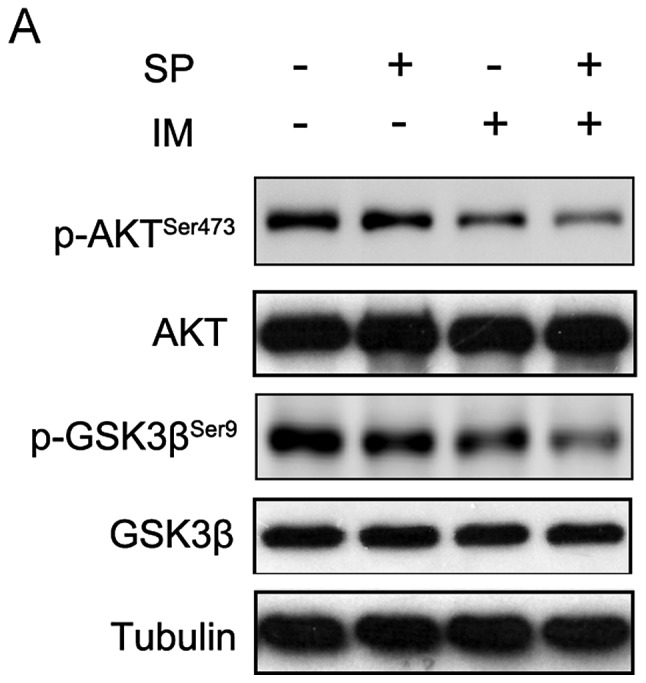
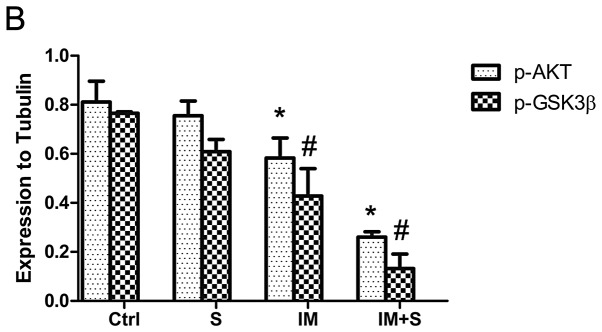
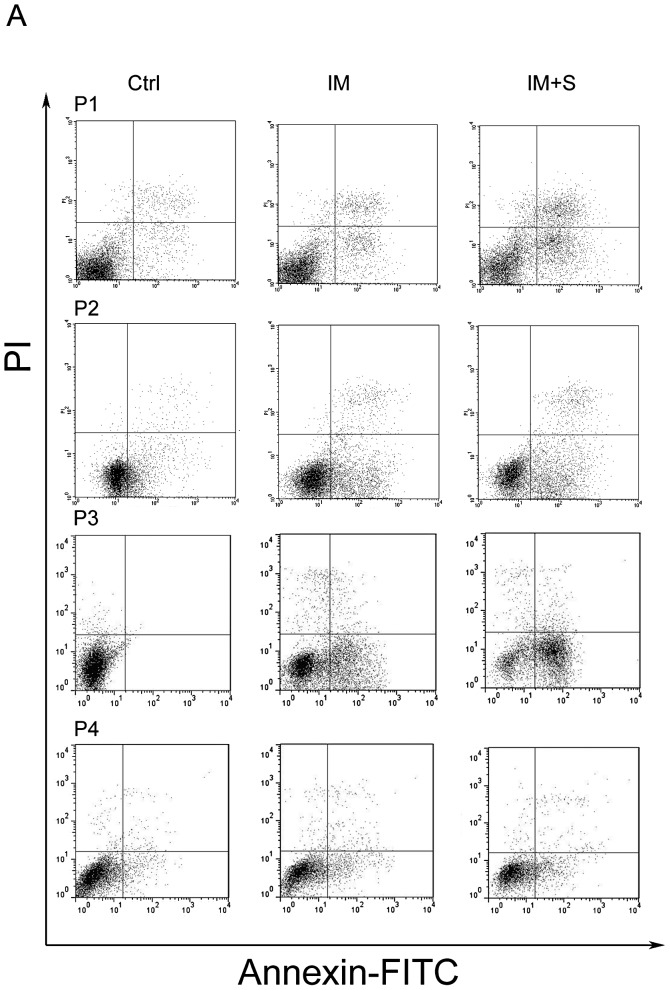
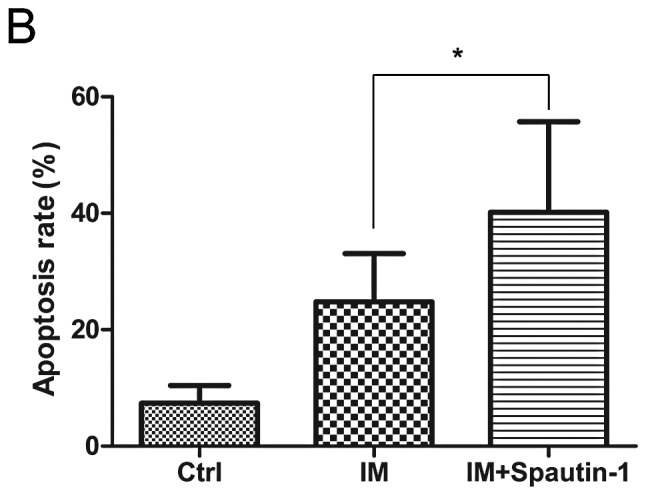
Imatinib mesylate (IM), a targeted competitive inhibitor of the BCR-ABL tyrosine kinase, has revolutionized the clinical treatment of chronic myeloid leukemia (CML). However, resistance and intolerance are still a challenge in the treatment of CML. Autophagy has been proposed to play a role in IM resistance. To investigate the anti-leukemic activity of specific and potent autophagy inhibitor-1 (spautin-1) in CML, we detected its synergistic effect with IM in K562 and CML cells. Our results showed that spautin-1 markedly inhibited IM-induced autophagy in CML cells by downregulating Beclin-1. Spautin-1 enhanced IM-induced CML cell apoptosis by reducing the expression of the anti-apoptotic proteins Mcl-1 and Bcl-2. We further demonstrated that the pro-apoptotic activity of spautin-1 was associated with activation of GSK3β, an important downstream effector of PI3K/AKT. The findings indicate that the autophagy inhibitor spautin-1 enhances IM-induced apoptosis by inactivating PI3K/AKT and activating downstream GSK3β, leading to downregulation of Mcl-1 and Bcl-2, which represents a promising approach to improve the efficacy of IM in the treatment of patients with CML.


Figures

Figure 1.
Figure 1.
Spautin-1 inhibits IM-induced autophagy in K562 cells. After treatment with or without IM (250 nM) for 12 h, spautin-1 (10 μM) or DMSO (0.1%) was added to K562 medium for further 36 h. (A) Autophagy was denoted by the switch of LC3I to LC3II, which was detected by western blotting (WB). (B) Other autophagy factors such as Beclin-1, ULK1, ATG 5 and ATG 7 were also detected by WB. (C) The bar chart demonstrates the ratio of LC3II and Beclin-1 proteins to tubulin by densitometry. Data are expressed as mean ± SD (#,*P≤0.05 between groups).
Figure 1.
Figure 1.
Spautin-1 inhibits IM-induced autophagy in K562 cells. After treatment with or without IM (250 nM) for 12 h, spautin-1 (10 μM) or DMSO (0.1%) was added to K562 medium for further 36 h. (A) Autophagy was denoted by the switch of LC3I to LC3II, which was detected by western blotting (WB). (B) Other autophagy factors such as Beclin-1, ULK1, ATG 5 and ATG 7 were also detected by WB. (C) The bar chart demonstrates the ratio of LC3II and Beclin-1 proteins to tubulin by densitometry. Data are expressed as mean ± SD (#,*P≤0.05 between groups).
Figure 2.
Figure 2.
Spautin-1 enhances IM-induced cytotoxicity in K562 cells. (A) Cells were treated with varying concentrations of IM for 48 h in the presence or absence of spautin-1 (10 μM). Cell viability was determined by CCK-8 assay. Data are expressed as the mean ± SD, and analyzed by Student’s t-test (*P<0.05 and **P<0.01). (B) Cell viability of spautin-1 alone (10 μM) group compared with control group after 48-h incubation. Cell viability was determined by CCK-8 assay. After treatment with 500 nM IM or DMSO for 12 h, spautin-1 (10 μM) or DMSO was added to K562 medium for further 36 h. (C) Changes in cellular morphology were examined by a light microscope (×200). (D) Cells were stained with Hoechst 33258 fluorescent stain. Changes were observed under a fluorescence microscope (×400). Arrows point to the apoptotic nuclei. (E) Apoptotic nuclei were quantified by counting 102 cells on three separate fields for each condition. Results from three independent experiments are shown. Data are expressed as mean ± SD (*P≤0.05).
Figure 2.
Figure 2.
Spautin-1 enhances IM-induced cytotoxicity in K562 cells. (A) Cells were treated with varying concentrations of IM for 48 h in the presence or absence of spautin-1 (10 μM). Cell viability was determined by CCK-8 assay. Data are expressed as the mean ± SD, and analyzed by Student’s t-test (*P<0.05 and **P<0.01). (B) Cell viability of spautin-1 alone (10 μM) group compared with control group after 48-h incubation. Cell viability was determined by CCK-8 assay. After treatment with 500 nM IM or DMSO for 12 h, spautin-1 (10 μM) or DMSO was added to K562 medium for further 36 h. (C) Changes in cellular morphology were examined by a light microscope (×200). (D) Cells were stained with Hoechst 33258 fluorescent stain. Changes were observed under a fluorescence microscope (×400). Arrows point to the apoptotic nuclei. (E) Apoptotic nuclei were quantified by counting 102 cells on three separate fields for each condition. Results from three independent experiments are shown. Data are expressed as mean ± SD (*P≤0.05).
Figure 3.
Figure 3.
Spautin-1 promotes IM-induced apoptosis in K562 cells. (A) K562 cells were treated with IM (500 nM) or DMSO (0.1%) for 12 h and then incubated with or without spautin-1 (10 μM) for further 36 h. Cells were analyzed by flow cytometry for cell cycle measurement. Results from the single experiment represent all the three experiments. K562 cells were treated with IM (250 or 500 nM) or DMSO (0.1%) for 12 h and then incubated with or without spautin-1 (10 μM) for further 36 h. (B and C) The apoptotic cells were quantified by Annexin V-PI staining using flow cytometry. Representative FACS data and a summary of three experiments are depicted. Data are mean ± SD (**P≤0.01). (D) Western blot analysis of caspase-3 and PARP cleavage. (E) The bar chart demonstrates the ratio of caspase-3 and PARP cleavage proteins to tubulin, by densitometry. Data are expressed as mean ± SD (*,#P≤0.05). (F) Western blot analysis of Mcl-1, Bim and Bcl-2. Tubulin served as a loading control. Representative blots of three independent experiments are shown.
Figure 3.
Figure 3.
Spautin-1 promotes IM-induced apoptosis in K562 cells. (A) K562 cells were treated with IM (500 nM) or DMSO (0.1%) for 12 h and then incubated with or without spautin-1 (10 μM) for further 36 h. Cells were analyzed by flow cytometry for cell cycle measurement. Results from the single experiment represent all the three experiments. K562 cells were treated with IM (250 or 500 nM) or DMSO (0.1%) for 12 h and then incubated with or without spautin-1 (10 μM) for further 36 h. (B and C) The apoptotic cells were quantified by Annexin V-PI staining using flow cytometry. Representative FACS data and a summary of three experiments are depicted. Data are mean ± SD (**P≤0.01). (D) Western blot analysis of caspase-3 and PARP cleavage. (E) The bar chart demonstrates the ratio of caspase-3 and PARP cleavage proteins to tubulin, by densitometry. Data are expressed as mean ± SD (*,#P≤0.05). (F) Western blot analysis of Mcl-1, Bim and Bcl-2. Tubulin served as a loading control. Representative blots of three independent experiments are shown.
Figure 4.
Figure 4.
AKT/GSK3β is involved in spautin-1 pro-apoptotic activity in CML cells. K562 cells were treated with IM (250 nM) or DMSO (0.1%) for 12 h and then incubated with or without spautin-1 (10 μM) for 36 h. (A) Total AKT, p-AKTser473, total GSK3β and p-GSK3βser9 levels were evaluated by WB. Tubulin served as a loading control. Representative blots of three independent experiments are shown. (B) The bar chart demonstrates the ratio of AKTser473 and GSK3βser9 proteins to tubulin by densitometry. Data are expressed as mean ± SD (*,#P≤0.05).
Figure 4.
Figure 4.
AKT/GSK3β is involved in spautin-1 pro-apoptotic activity in CML cells. K562 cells were treated with IM (250 nM) or DMSO (0.1%) for 12 h and then incubated with or without spautin-1 (10 μM) for 36 h. (A) Total AKT, p-AKTser473, total GSK3β and p-GSK3βser9 levels were evaluated by WB. Tubulin served as a loading control. Representative blots of three independent experiments are shown. (B) The bar chart demonstrates the ratio of AKTser473 and GSK3βser9 proteins to tubulin by densitometry. Data are expressed as mean ± SD (*,#P≤0.05).
Figure 5.
Figure 5.
Spautin-1 potentiates the efficacy of IM in primary CML cells. Flow cytometry results of primary CML cells treated with IM with or without spautin-1. Primary cells were treated with IM (2 μM) or DMSO (0.1%) for 12 h and then incubated with or without spautin-1 (10 μM) for 36 h. (A) The apoptotic cells were quantified by Annexin V-PI staining using flow cytometry. (B) The bar chart demonstrates the ratio of apoptotic cells among the groups. Data are expressed as mean ± SD (*P<0.05 between groups).
Figure 5.
Figure 5.
Spautin-1 potentiates the efficacy of IM in primary CML cells. Flow cytometry results of primary CML cells treated with IM with or without spautin-1. Primary cells were treated with IM (2 μM) or DMSO (0.1%) for 12 h and then incubated with or without spautin-1 (10 μM) for 36 h. (A) The apoptotic cells were quantified by Annexin V-PI staining using flow cytometry. (B) The bar chart demonstrates the ratio of apoptotic cells among the groups. Data are expressed as mean ± SD (*P<0.05 between groups).

Similar articles

Cited by

References

    1. Elzinga BM, Nyhan MJ, Crowley LC, O’Donovan TR, Cahill MR, McKenna SL. Induction of autophagy by Imatinib sequesters Bcr-Abl in autophagosomes and down-regulates Bcr-Abl protein. Am J Hematol. 2013;88:455–462. doi: 10.1002/ajh.23428. - DOI - PubMed
    1. Cortez D, Reuther G, Pendergast AM. The Bcr-Abl tyrosine kinase activates mitogenic signaling pathways and stimulates G1-to-S phase transition in hematopoietic cells. Oncogene. 1997;15:2333–2342. doi: 10.1038/sj.onc.1201400. - DOI - PubMed
    1. Yang X, Lin J, Gong Y, et al. Antileukaemia effect of rapamycin alone or in combination with daunorubicin on ph+ acute lymphoblastic leukaemia cell line. Hematol Oncol. 2012;30:123–130. doi: 10.1002/hon.1013. - DOI - PubMed
    1. Carew JS, Nawrocki ST, Giles FJ, Cleveland JL. Targeting autophagy: a novel anticancer strategy with therapeutic implications for imatinib resistance. Biologics. 2008;2:201–204. - PMC - PubMed
    1. Burchert A. Roots of imatinib resistance: a question of self-renewal? Drug Resist Updat. 2007;10:152–161. doi: 10.1016/j.drup.2007.06.001. - DOI - PubMed

MeSH terms