

The immunostimulatory effects of retinoblastoma cell supernatant on dendritic cells
- PMID: 24585413
- PMCID: PMC3978164
- DOI: 10.1007/s13238-014-0029-0
The immunostimulatory effects of retinoblastoma cell supernatant on dendritic cells
Abstract
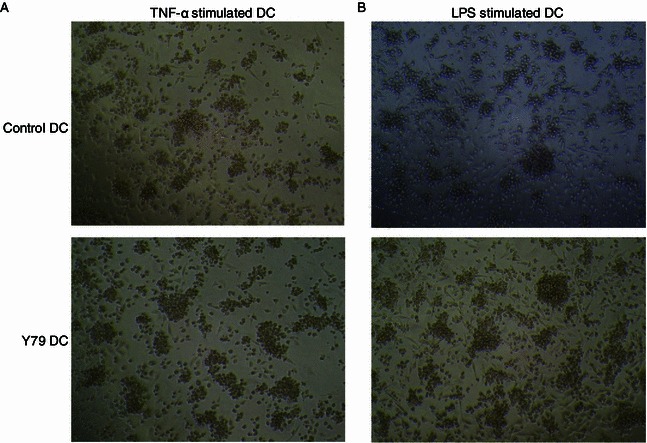
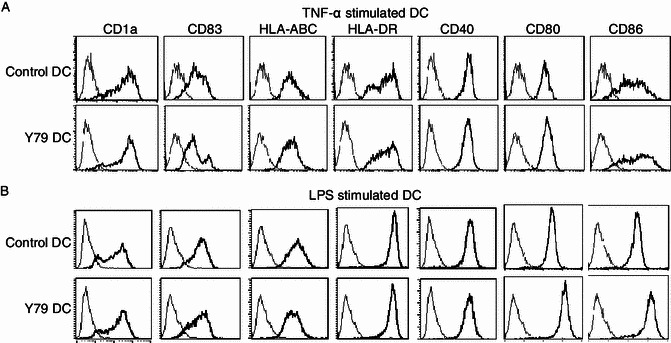
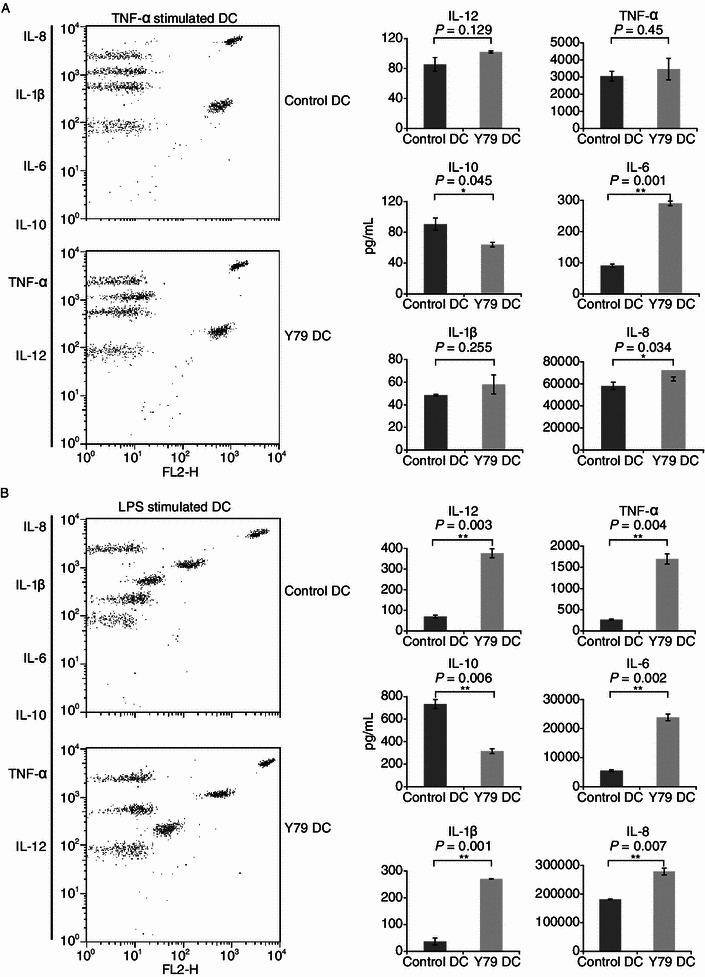
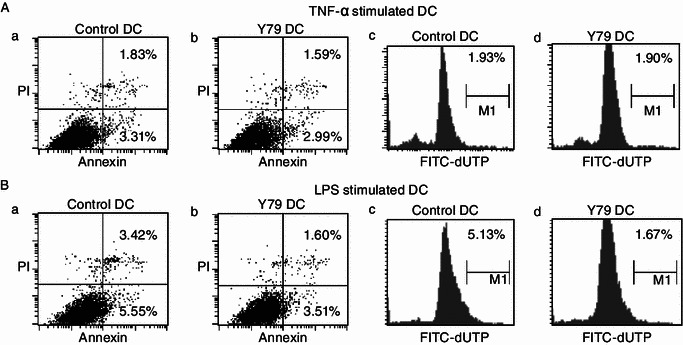
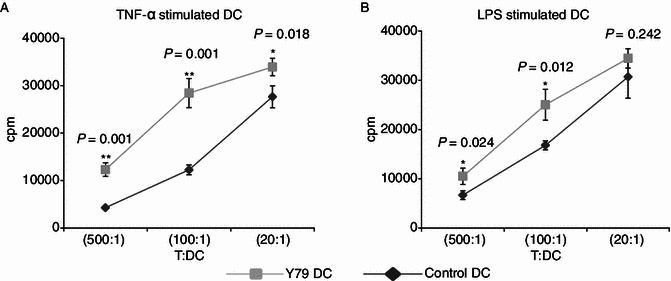
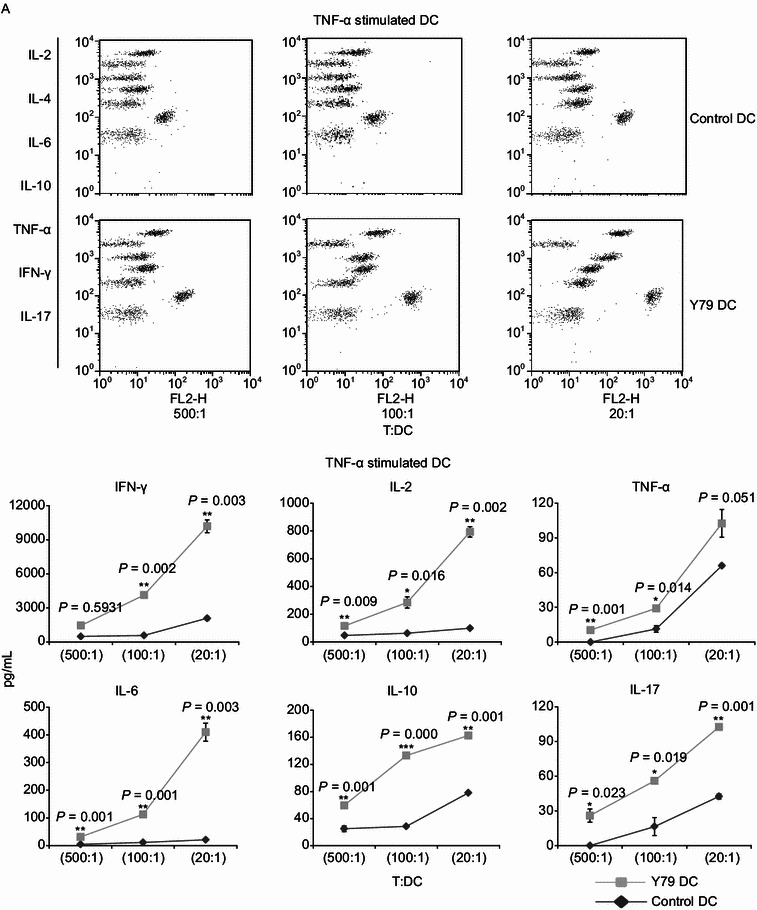
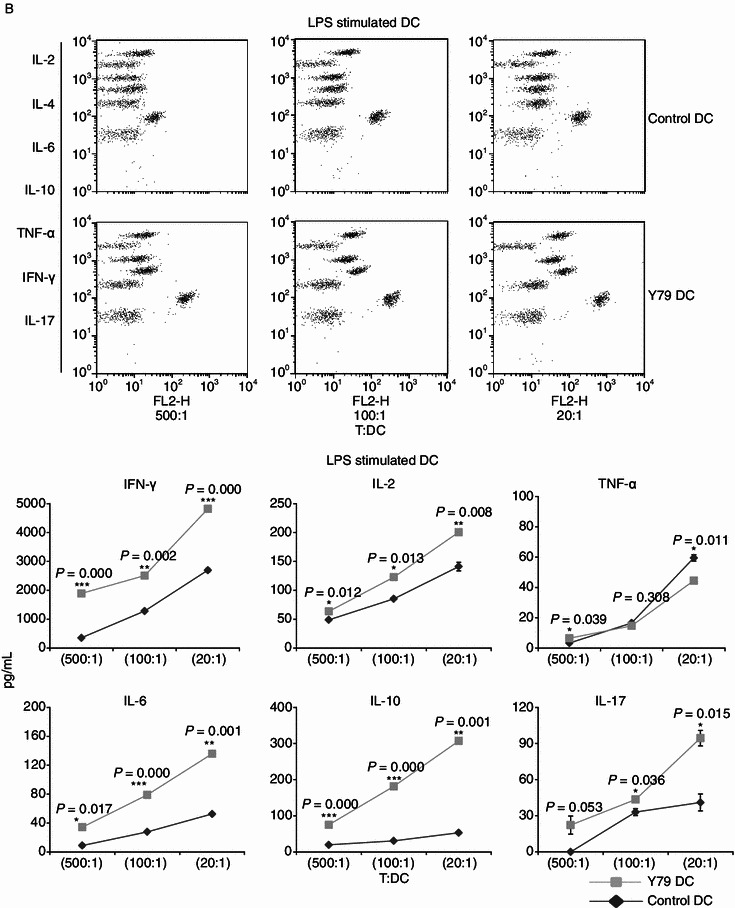
Dendritic cells (DCs) are crucial for the induction and maintenance of tumor-specific immune responses. Studies have shown that tumor-associated DCs are immunosuppressed in some human tumors. However, phenotype and function of DCs in retinoblastoma (RB) remain unclear. RB cell supernatant (RBcs) was used to treat DCs in vitro to explore the effect of RB cells on DCs. DCs were generated from peripheral blood mononuclear cells of healthy donors. On day 5 of culture, DCs were treated with RBcs for 24 h, and then purified using magnetic beads. The maturation of DCs was induced by TNF-α or LPS. After treatment with RBcs, expression of co-stimulatory molecules CD80 and CD86 was elevated in DCs, accompanied by increased production of IL-12p70, TNF-α, IL-6, IL-1β, and IL-8 but decreased production of IL-10. RBcs neither inhibited DC maturation nor promoted DC apoptosis. Moreover, RBcs-exposed DCs stimulated allogenetic T cell proliferation and T cell-derived cytokine production. These results indicate that RBcs can improve DCs' antigen presenting function and capability to activate T cells, suggesting that RB cells may have an immunostimulatory effect on DCs, and DC-based immunotherapy may be adopted in the treatment of RB.
Figures
Similar articles
-
[Blocking p38MAPK pathway inhibits the proliferation of OT-II cells mediated by splenic dendritic cells].Xi Bao Yu Fen Zi Mian Yi Xue Za Zhi. 2016 Mar;32(3):289-93. Xi Bao Yu Fen Zi Mian Yi Xue Za Zhi. 2016. PMID: 26927543 Chinese.
-
Marina crystal minerals (MCM) activate human dendritic cells to induce CD4+ and CD8+ T cell responses in vitro.Int J Immunopathol Pharmacol. 2018 Jan-Dec;32:2058738418797768. doi: 10.1177/2058738418797768. Int J Immunopathol Pharmacol. 2018. PMID: 30270704 Free PMC article.
-
Sequential delivery of maturation stimuli increases human dendritic cell IL-12 production and enhances tumor antigen-specific immunogenicity.J Surg Res. 2004 Jan;116(1):24-31. doi: 10.1016/j.jss.2003.09.003. J Surg Res. 2004. PMID: 14732346
-
Effects of histamine and its antagonists on murine T-cells and bone marrow-derived dendritic cells.Drug Des Devel Ther. 2015 Aug 21;9:4847-60. doi: 10.2147/DDDT.S89792. eCollection 2015. Drug Des Devel Ther. 2015. PMID: 26346531 Free PMC article.
-
Activation of the aryl hydrocarbon receptor affects activation and function of human monocyte-derived dendritic cells.Clin Exp Immunol. 2014 Aug;177(2):521-30. doi: 10.1111/cei.12352. Clin Exp Immunol. 2014. PMID: 24749687 Free PMC article.
Cited by
-
Blockade of MCP-1/CCR4 signaling-induced recruitment of activated regulatory cells evokes an antitumor immune response in head and neck squamous cell carcinoma.Oncotarget. 2016 Jun 21;7(25):37714-37727. doi: 10.18632/oncotarget.9265. Oncotarget. 2016. PMID: 27177223 Free PMC article.
-
Atorvastatin, Losartan and Captopril Lead to Upregulation of TGF-β, and Downregulation of IL-6 in Coronary Artery Disease and Hypertension.PLoS One. 2016 Dec 29;11(12):e0168312. doi: 10.1371/journal.pone.0168312. eCollection 2016. PLoS One. 2016. PMID: 28033321 Free PMC article.
-
Bioinformatics Analysis and Experimental Identification of Immune-Related Genes and Immune Cells in the Progression of Retinoblastoma.Invest Ophthalmol Vis Sci. 2022 Oct 3;63(11):28. doi: 10.1167/iovs.63.11.28. Invest Ophthalmol Vis Sci. 2022. PMID: 36315123 Free PMC article.
-
Alpha radionuclide-chelated radioimmunotherapy promoters enable local radiotherapy/chemodynamic therapy to discourage cancer progression.Biomater Res. 2022 Sep 8;26(1):44. doi: 10.1186/s40824-022-00290-6. Biomater Res. 2022. PMID: 36076298 Free PMC article.
-
Growth Inhibition of Retinoblastoma Cell Line by Exosome-Mediated Transfer of miR-142-3p.Cancer Manag Res. 2022 Jun 29;14:2119-2131. doi: 10.2147/CMAR.S351979. eCollection 2022. Cancer Manag Res. 2022. PMID: 35791342 Free PMC article.
References
-
- Beckebaum S, Zhang X, Chen X, Yu Z, Frilling A, Dworacki G, Grosse-Wilde H, Broelsch CE, Gerken G, Cicinnati VR. Increased levels of interleukin-10 in serum from patients with hepatocellular carcinoma correlate with profound numerical deficiencies and immature phenotype of circulating dendritic cell subsets. Clin Cancer Res. 2004;10:7260–7269. doi: 10.1158/1078-0432.CCR-04-0872. - DOI - PubMed
Publication types
MeSH terms
Substances
LinkOut - more resources
Full Text Sources
Other Literature Sources
