. 2014 Feb;26(2):665-77.
doi: 10.1105/tpc.114.122663. Epub 2014 Feb 28.

The ubiquitin receptor DA1 regulates seed and organ size by modulating the stability of the ubiquitin-specific protease UBP15/SOD2 in Arabidopsis

Affiliations

The ubiquitin receptor DA1 regulates seed and organ size by modulating the stability of the ubiquitin-specific protease UBP15/SOD2 in Arabidopsis

Liang Du et al. Plant Cell. 2014 Feb.

Abstract

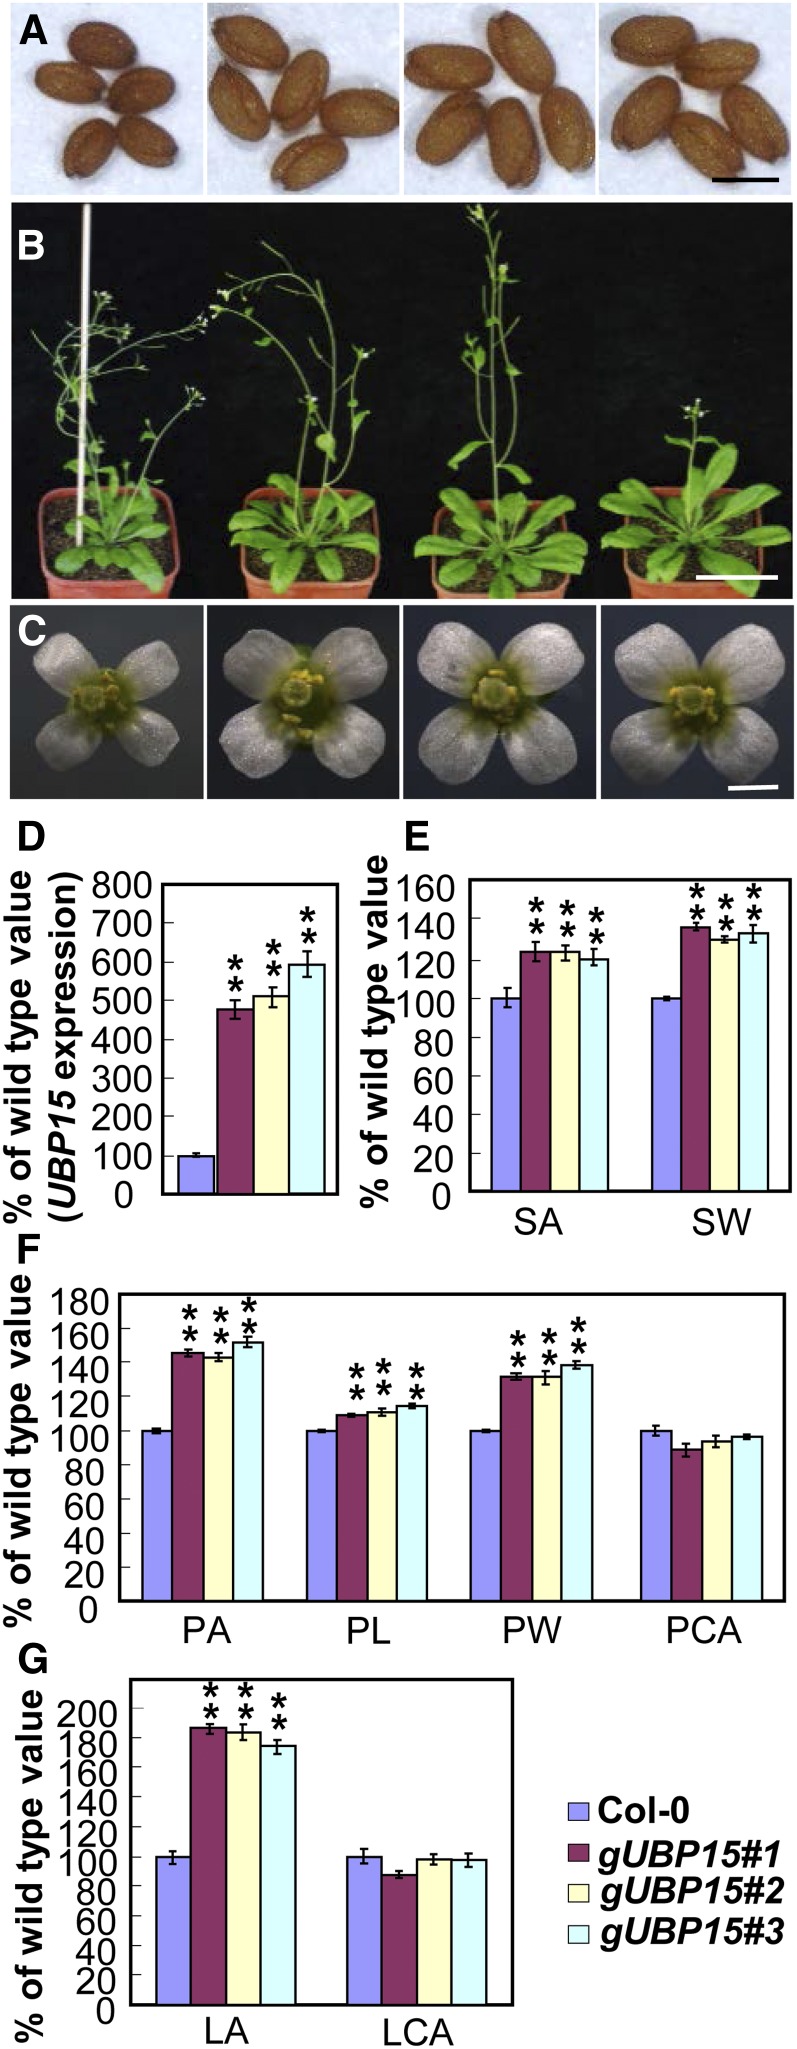
Although the control of organ size is a fundamental question in developmental biology, little is known about the genetic and molecular mechanisms that determine the final size of seeds in plants. We previously demonstrated that the ubiquitin receptor DA1 acts synergistically with the E3 ubiquitin ligases DA2 and ENHANCER1 OF DA1 (EOD1)/BIG BROTHER to restrict seed growth in Arabidopsis thaliana. Here, we describe UBIQUITIN-SPECIFIC PROTEASE15 (UBP15), encoded by SUPPRESSOR2 OF DA1 (SOD2), which acts maternally to regulate seed size by promoting cell proliferation in the integuments of ovules and developing seeds. The sod2/ubp15 mutants form small seeds, while overexpression of UBP15 increases seed size of wild-type plants. Genetic analyses indicate that UBP15 functions antagonistically in a common pathway with DA1 to influence seed size, but does so independently of DA2 and EOD1. Further results reveal that DA1 physically associates with UBP15 in vitro and in vivo and modulates the stability of UBP15. Therefore, our findings establish a genetic and molecular framework for the regulation of seed size by four ubiquitin-related proteins DA1, DA2, EOD1, and UBP15 and suggest that they are promising targets for increasing seed size in crops.


Figures

Figure 1.
Figure 1.
sod2 Suppresses the Seed Size Phenotype of da1-1. (A) to (C) Seeds of Col-0 (A), da1-1 (B), and sod2-1 da1-1 (C). (D) to (F) Ten-day-old seedlings of Col-0 (D), da1-1 (E), and sod2-1 da1-1 (F). (G) to (I) Flowers of Col-0 (G), da1-1 (H), and sod2-1 da1-1 (I). (J) Seed area (SA) and seed weight (SW) of Col-0, da1-1, sod2-1 da1-1, and sod2-2 da1-1 plants. (K) Fifth leaf area (LA) and leaf palisade cell area (LCA) of Col-0, da1-1, sod2-1 da1-1, and sod2-2 da1-1 plants. (L) Petal area (PA), petal length (PL), petal width (PW), and petal cell area (PCA) of Col-0, da1-1, sod2-1 da1-1, and sod2-2 da1-1 plants. Values in (J) to (L) are given as mean ± se relative to the respective wild-type values, set at 100%. **P < 0.01 compared with the da1-1 (Student’s t test). Bars = 0.5 mm in (A) to (C) and 1 mm in (D) to (I).
Figure 2.
Figure 2.
Identification and Molecular Characterization of the SOD2/UBP15 Gene. (A) The SOD2/UBP15 gene structure. The start codon (ATG) and the stop codon (TAG) are indicated. Closed boxes indicate the coding sequence, open boxes indicate the 5′ and 3′ untranslated regions, and lines between boxes indicate introns. The mutation sites of sod2-1 and sod2-2 and the T-DNA insertion site in ubp15-1 are shown. (B) The SOD2 protein contains a Zf-MYND and a UBP domain. (C) Plants (21-d-old) of da1-1, sod2-2 da1-1, COM#1, and COM#2 (from left to right). COM is sod2-2 da1-1 transformed with the genomic sequence of the UBP15 gene (gUBP15). (D) Flowers of da1-1, sod2-2 da1-1, COM#1, and COM#2 (from left to right). (E) Seeds of da1-1, sod2-2 da1-1, COM#1, and COM#2 (from left to right). (F) Seed area (SA) and seed weight (SW) of da1-1, sod2-2 da1-1, COM#1, and COM#2. (G) Petal area (PA), petal length (PL) and petal width (PW) of da1-1, sod2-2 da1-1, COM#1, and COM#2. (H) to (O) UBP15 expression activity was monitored by pUBP15:GUS transgene expression. Six GUS-expressing lines were observed, and all showed a similar pattern, although they differed slightly in the intensity of the staining. Histochemical analysis of GUS activity in an 8-d-old seedling (H), the developing sepals (I), the developing petals (J), the developing stamens (K), the developing carpels (L), and the developing ovules ([M] to [O]). Values in (F) and (G) are given as mean ± se relative to the respective da1-1 values, set at 100%. **P < 0.01 compared with the sod2-2 da1-1 (Student’s t test). Bars = 5 cm in (C), 1 mm in (D) and (H), 0.5 mm in (E), and 0.1 mm in (I) to (O).
Figure 3.
Figure 3.
UBP15 Acts Maternally to Regulate Seed Size. (A) Seeds of Col-0 (left) and ubp15-1 (right). (B) Mature embryos of Col-0 (left) and ubp15-1 (right). (C) Seven-day-old seedlings of Col-0 (left) and ubp15-1 (right). (D) Mature ovules of Col-0 (left) and ubp15-1 (right). (E) Seed area (SA) and seed weight (SW) of Col-0 and ubp15-1. (F) Cotyledon area (CoA) of Col-0 and ubp15-1. (G) Seed area of Col-0 × Col-0 F1, ubp15-1 × ubp15-1 F1, Col-0 × ubp15-1 F1, ubp15-1 × Col-0 F1, Col-0 × ubp15-1 F2, and ubp15-1 × Col-0 F2. (H) The outer integument length of Col-0 and ubp15-1 at 0, 6, and 8 DAP. Ovules at 0 DAP are mature ovules from wild-type and ubp15-1 plants 2 d after emasculation. (I) The number of cells in the outer integuments of Col-0 and ubp15-1 at 0, 6, and 8 DAP. (J) The length of cells in the outer integuments of Col-0 and ubp15-1 at 0, 6, and 8 DAP. Values in (E) to (J) are given as mean ± se relative to the respective wild-type values, set at 100%. **P < 0.01 and *P < 0.05 compared with the wild type (Student’s t test). Bars = 0.5 mm in (A), 0.25 mm in (B), 1 mm in (C), and 0.1 mm in (D).
Figure 4.
Figure 4.
Plants Overexpressing UBP15 Show Similar Phenotypes to da1-1. (A) Seeds of Col-0, gUBP15#1, gUBP15#2, and gUBP15#3 plants (from left to right). gUBP15 is Col-0 transformed with the genomic sequence of the UBP15 gene. (B) Plants (28 d old) of Col-0, gUBP15#1, gUBP15#2, and gUBP15#3 (from left to right). (C) Flowers of Col-0, gUBP15#1, gUBP15#2, and gUBP15#3 (from left to right). (D) Quantitative real-time RT-PCR analysis of the UBP15 gene expression in Col-0, gUBP15#1, gUBP15#2, and gUBP15#3 seedlings. (E) Seed area (SA) and seed weight (SW) of Col-0, gUBP15#1, gUBP15#2, and gUBP15#3. (F) Petal area (PA), petal length (PL), petal width (PW), and petal cell area (PCA) of Col-0, gUBP15#1, gUBP15#2, and gUBP15#3. (G) The average area of the fifth leaves (LA) and palisade cells (LCA) of Col-0, gUBP15#1, gUBP15#2, and gUBP15#3. Values in (D) to (G) are given as mean ± se relative to the respective wild-type values, set at 100%. **P < 0.01 compared with the wild type (Student’s t test). Bars = 0.5 mm in (A), 5 cm in (B), and 1 mm in (C).
Figure 5.
Figure 5.
ubp15-1 Is Epistatic to da1-1. (A) Seeds of Col-0, ubp15-1, da1-1, and ubp15-1 da1-1. (B) Mature embryos of Col-0, ubp15-1, da1-1, and ubp15-1 da1-1. (C) Seed area (SA) and seed weight (SW) of Col-0, ubp15-1, da1-1, and ubp15-1 da1-1. (D) The outer integument length of Col-0, ubp15-1, da1-1, and ubp15-1 da1-1 at 0, 6, and 8 DAP. (E) The number of cells in the outer integuments of Col-0, ubp15-1, da1-1, and ubp15-1 da1-1 at 0, 6, and 8 DAP. Values in (C) to (E) are given as mean ± se relative to the respective wild-type values, set at 100%. **P < 0.01 compared with the wild type (Student’s t test). Bars = 0.5 mm in (A) and 0.25 mm in (B).
Figure 6.
Figure 6.
DA1 Modulates UBP15 Stability. (A) The proteasome inhibitor stabilizes UBP15. Ten-day-old gUBP15-GFP seedlings were treated with or without 20 μM MG132. Total protein extracts were subjected to immunoblot assays using anti-GFP and anti-RPN6 (as loading control) antibodies. (B) The UBP15-GFP protein accumulates at higher levels in the da1-1 mutant. Total protein extracts were subjected to immunoblot assays using anti-GFP and anti-RPN6 (as loading control) antibodies. (C) Seeds of gUBP15-GFP#7 and gUBP15-GFP#7;da1-1. (D) Flowers of gUBP15-GFP#7 and gUBP15-GFP#7;da1-1. (E) The relative expression of UBP15 in gUBP15-GFP#7 and gUBP15-GFP#7;da1-1. Data shown are mean ± sd of three replicates. (F) Seed area (SA) and seed weight (SW) of gUBP15-GFP#7 and gUBP15-GFP#7;da1-1. (G) Petal area (PA), petal length (PL), and petal width (PW) of gUBP15-GFP#7 and gUBP15-GFP#7;da1-1. Values in (F) and (G) are given as mean ± se relative to the respective gUBP15-GFP#7 values, set at 100%. **P < 0.01 compared with gUBP15-GFP#7 (Student’s t test). Bars = 0.5 mm in (C) and 1 mm in (D).
Figure 7.
Figure 7.
DA1 Physically Interacts with UBP15 in Vitro and in Vivo. (A) DA1 directly interacts with UBP15 in vitro. GST-DA1 and GST-DA1R358K were pulled down (PD) by MBP-UBP15 immobilized on amylose resin and analyzed by immunoblotting (IB) using an anti-GST antibody. (B) The C terminus of DA1 interacts with UBP15 in vitro. Both GST-DA1-LIM+C and GST-DA1-C were pulled down by MBP-UBP15 immobilized on amylose resin and analyzed by immunoblotting using an anti-GST antibody. (C) The C-terminal region of UBP15 interacts with DA1 in vitro. GST-DA1 was pulled down by MBP-UBP15-C immobilized on amylose resin and analyzed by immunoblotting using an anti-GST antibody. (D) UBP15 interacts with DA1 in vivo. N. benthamiana leaves were transformed by injection of Agrobacterium tumefaciens EHA105 cells harboring 35S:GFP-UBP15 and 35S:Myc-DA1 plasmids. Myc-DA1 was detected in the immunoprecipitated GFP-UBP15 complex, indicating that there is a physical association between DA1 and UBP15 in vivo. (E) Schematic diagram of DA1 and its derivatives containing specific domains. The DA1 contains two UIM motifs in the N terminus, a single LIM domain, and the C-terminal region. aa, amino acid. (F) Schematic diagram of UBP15, UBP15-N, and UBP15-C. The UBP15 contains one predicted Zf-MYND domain in the N terminus and the UBP domain in the C-terminal region. (G) A genetic and molecular framework for DA1, DA2, EOD1/BB, and UBP15/SOD2-mediated regulation of seed and organ size. DA1 and DA2 act synergistically to restrict seed and organ size, suggesting that DA1 and DA2 may have a common downstream substrate. Similarly, DA1 and EOD1 may share a common target. However, DA2 acts independently of EOD1 to influence seed and organ size, suggesting that DA2 and EOD1 may target distinct cell proliferation stimulators (substrate 1 and substrate 2) for degradation, with common regulation via DA1. DA1 acts the upstream of UBP15 and modulates UBP15 stability. However, UBP15 acts independently of DA2 and EOD1, suggesting that UBP15 is not the target of DA2 or EOD1 for degradation.

References

    1. Adamski N.M., Anastasiou E., Eriksson S., O’Neill C.M., Lenhard M. (2009). Local maternal control of seed size by KLUH/CYP78A5-dependent growth signaling. Proc. Natl. Acad. Sci. USA 106: 20115–20120. - PMC - PubMed
    1. Alonso-Blanco C., Blankestijn-de Vries H., Hanhart C.J., Koornneef M. (1999). Natural allelic variation at seed size loci in relation to other life history traits of Arabidopsis thaliana. Proc. Natl. Acad. Sci. USA 96: 4710–4717. - PMC - PubMed
    1. Disch S., Anastasiou E., Sharma V.K., Laux T., Fletcher J.C., Lenhard M. (2006). The E3 ubiquitin ligase BIG BROTHER controls arabidopsis organ size in a dosage-dependent manner. Curr. Biol. 16: 272–279. - PubMed
    1. Fan C., Xing Y., Mao H., Lu T., Han B., Xu C., Li X., Zhang Q. (2006). GS3, a major QTL for grain length and weight and minor QTL for grain width and thickness in rice, encodes a putative transmembrane protein. Theor. Appl. Genet. 112: 1164–1171. - PubMed
    1. Fang W., Wang Z., Cui R., Li J., Li Y. (2012). Maternal control of seed size by EOD3/CYP78A6 in Arabidopsis thaliana. Plant J. 70: 929–939. - PubMed

Publication types