

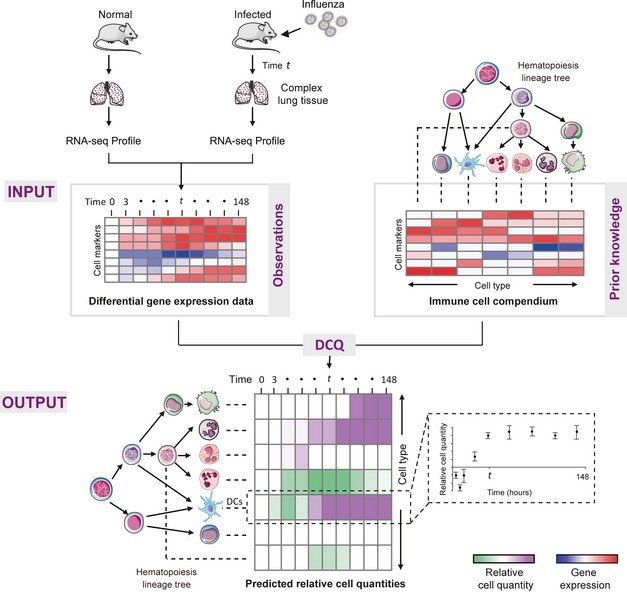
Digital cell quantification identifies global immune cell dynamics during influenza infection
- PMID: 24586061
- PMCID: PMC4023392
- DOI: 10.1002/msb.134947
Digital cell quantification identifies global immune cell dynamics during influenza infection
Abstract
Hundreds of immune cell types work in coordination to maintain tissue homeostasis. Upon infection, dramatic changes occur with the localization, migration, and proliferation of the immune cells to first alert the body of the danger, confine it to limit spreading, and finally extinguish the threat and bring the tissue back to homeostasis. Since current technologies can follow the dynamics of only a limited number of cell types, we have yet to grasp the full complexity of global in vivo cell dynamics in normal developmental processes and disease. Here, we devise a computational method, digital cell quantification (DCQ), which combines genome-wide gene expression data with an immune cell compendium to infer in vivo changes in the quantities of 213 immune cell subpopulations. DCQ was applied to study global immune cell dynamics in mice lungs at ten time points during 7 days of flu infection. We find dramatic changes in quantities of 70 immune cell types, including various innate, adaptive, and progenitor immune cells. We focus on the previously unreported dynamics of four immune dendritic cell subtypes and suggest a specific role for CD103(+) CD11b(-) DCs in early stages of disease and CD8(+) pDC in late stages of flu infection.
Figures
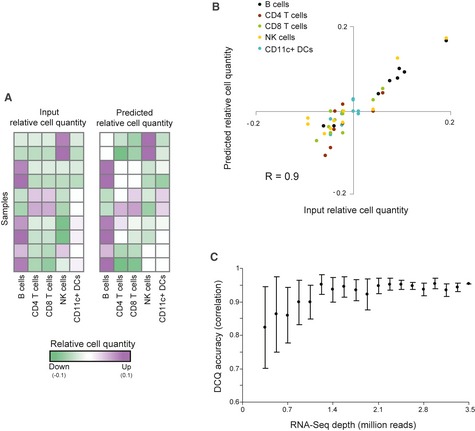
Performance analysis on ten samples generated using an in vitro‐defined complex cell mixture (see Materials and Methods). The two matrices indicate the agreement among relative quantities that were inferred by
DCQ (right) and the input relative cell quantities (left) for ten different experimental samples (rows), each of which involves five immune cell subsets (columns). Increase or decrease in cell quantity is color‐coded in purple and green, respectively.A summary of
DCQ 's predicted relative cell quantities (y‐axis) and input relative cell quantities (x‐axis) across all ten samples from a. The plot indicates the high correlation in each of the cell types (color‐coded: black—B cells; brown—CD 4+ T cells; green—CD 8+ T cells; yellow—NK cells; cyan—CD 11c+DC s).The effect of
RNA sequencing depth onDCQ performance, tested on the dataset from a. Accuracy ofDCQ predictions (y‐axis) are presented for variousRNA sequencing depths (x‐axis). Accuracy is evaluated as correlation between predicted and input (“true”) relative cell quantities. Depicted are average of correlation and standard deviation over ten samples of each sequencing depth. The evident saturation with increasing depths implies that a sequencing depth of 2.5 million reads or higher is sufficient to provide highDCQ accuracy.
- A
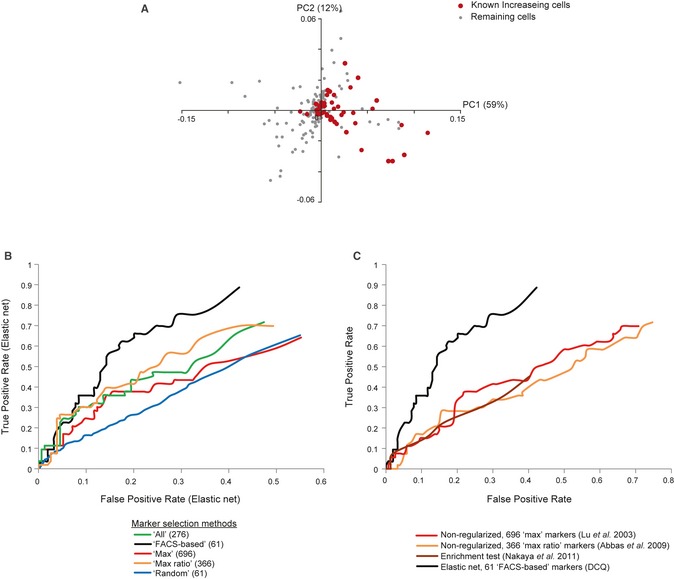
Principle component analysis (
PCA ) ofDCQ 's predicted relative cell quantities. ThePCA was applied on the profiles of predicted relative cell quantities for each cell type, at ten time points during influenza infection. Shown is a scatter plot of each cell type for the first two principle componentsPC 1 andPC 2. Red, cell types that were previously reported as increasing in quantity during infection; gray, the remaining cell types. - B, C
Comparison of performance. False‐ (x‐axis) and true‐positive (y‐axis) rates of
DCQ predictions. Rates are calculated for comparing predicted increase in cell quantities versus the known increasing cell types. In (B), we compare five alternative methods for selecting gene markers. In (C), we compareDCQ to several alternative computational cell quantification approaches, each consists of a different mathematical formulation and a different set of markers. The plots suggest the superiority ofDCQ , and in particular itsFACS ‐based selection of markers, over extant methods.

Validation of cell quantity dynamics of four dendritic cell subtypes. Dendritic cell quantities (y‐axis) as predicted by digital cell quantification (
DCQ ) (blue diamonds) and measured byFACS (red diamonds) for two mice at each time point (x‐axis). The plot indicates the high correlation betweenDCQ predictions andFACS validations.PCA analysis of the genome‐wide transcriptional responses to influenza infection. ThePCA was applied onRNA ‐Seq expression values that were profiled on isolatedDC s (normalized by the respective values before infection). Shown are three time points (1, 3, and 5 days) for each of theDC subsets (blue,CD 8+pDC ; green,CD 8−pDC ; red,CD 103−CD 11b+cDC s; brown,CD 103+CD 11b−cDC s; black, lung tissue).Expression of
CCL 17 (y‐axis) at four time points during influenza infection (x‐axis) for fourDC subsets (color‐coded as in B).Gene expression profiles of four
DC s populations during influenza infection in lung. Left: Shown are the (log2 ratio) expression levels of selected genes (rows) at three time points (columns) for four isolated subsets ofDC s relative to control subsets before infection; Z‐normalized per row. Previously reported inflammatory and anti‐viral genes in dendritic cells are marked in left (blue, Amit et al, 2009; Gat‐Viks et al, 2013). Cluster C–I is highlighted. Right: average expression (y‐axis) at each time point (x‐axis) of genes in clusters C‐I, for the four isolatedDC subsets (color‐coded as in B).
References
-
- Amit I, Garber M, Chevrier N, Leite AP, Donner Y, Eisenhaure T, Guttman M, Grenier JK, Li W, Zuk O, Schubert LA, Birditt B, Shay T, Goren A, Zhang X, Smith Z, Deering R, McDonald RC, Cabili M, Bernstein BEet al (2009) Unbiased reconstruction of a mammalian transcriptional network mediating pathogen responses. Science 326: 257–263 - PMC - PubMed
-
- Bendall SC, Simonds EF, Qiu P, el Amir AD, Krutzik PO, Finck R, Bruggner RV, Melamed R, Trejo A, Ornatsky OI, Balderas RS, Plevritis SK, Sachs K, Pe'er D, Tanner SD, Nolan GP (2011) Single‐cell mass cytometry of differential immune and drug responses across a human hematopoietic continuum. Science 332: 687–696 - PMC - PubMed
-
- Benoist C, Lanier L, Merad M, Mathis D, Immunological Genome P (2012) Consortium biology in immunology: the perspective from the Immunological Genome Project. Nat Rev Immunol 12: 734–740 - PubMed
Publication types
MeSH terms
Substances
Associated data
- Actions
LinkOut - more resources
Full Text Sources
Other Literature Sources
Medical
Molecular Biology Databases
Research Materials
