A compositional look at the human gastrointestinal microbiome and immune activation parameters in HIV infected subjects
- PMID: 24586144
- PMCID: PMC3930561
- DOI: 10.1371/journal.ppat.1003829
A compositional look at the human gastrointestinal microbiome and immune activation parameters in HIV infected subjects
Abstract
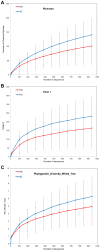
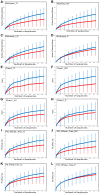
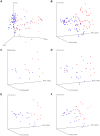
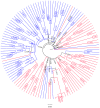
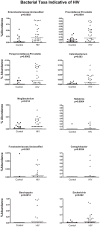
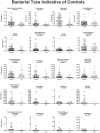
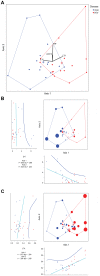
HIV progression is characterized by immune activation and microbial translocation. One factor that may be contributing to HIV progression could be a dysbiotic microbiome. We therefore hypothesized that the GI mucosal microbiome is altered in HIV patients and this alteration correlates with immune activation in HIV. 121 specimens were collected from 21 HIV positive and 22 control human subjects during colonoscopy. The composition of the lower gastrointestinal tract mucosal and luminal bacterial microbiome was characterized using 16S rDNA pyrosequencing and was correlated to clinical parameters as well as immune activation and circulating bacterial products in HIV patients on ART. The composition of the HIV microbiome was significantly different than that of controls; it was less diverse in the right colon and terminal ileum, and was characterized by loss of bacterial taxa that are typically considered commensals. In HIV samples, there was a gain of some pathogenic bacterial taxa. This is the first report characterizing the terminal ileal and colonic mucosal microbiome in HIV patients with next generation sequencing. Limitations include use of HIV-infected subjects on HAART therapy.
Conflict of interest statement
The authors have declared that no competing interests exist.
Figures


Similar articles
-
An altered intestinal mucosal microbiome in HIV-1 infection is associated with mucosal and systemic immune activation and endotoxemia.Mucosal Immunol. 2014 Jul;7(4):983-94. doi: 10.1038/mi.2013.116. Epub 2014 Jan 8. Mucosal Immunol. 2014. PMID: 24399150 Free PMC article.
-
Effect of cytomegalovirus and Epstein-Barr virus replication on intestinal mucosal gene expression and microbiome composition of HIV-infected and uninfected individuals.AIDS. 2017 Sep 24;31(15):2059-2067. doi: 10.1097/QAD.0000000000001579. AIDS. 2017. PMID: 28906277 Free PMC article.
-
The effects of prebiotics on microbial dysbiosis, butyrate production and immunity in HIV-infected subjects.Mucosal Immunol. 2017 Sep;10(5):1279-1293. doi: 10.1038/mi.2016.122. Epub 2016 Dec 21. Mucosal Immunol. 2017. PMID: 28000678 Clinical Trial.
-
Therapeutic avenues for restoring the gut microbiome in HIV infection.Curr Opin Pharmacol. 2020 Oct;54:188-201. doi: 10.1016/j.coph.2020.09.010. Epub 2020 Nov 30. Curr Opin Pharmacol. 2020. PMID: 33271427 Review.
-
Gut barrier structure, mucosal immunity and intestinal microbiota in the pathogenesis and treatment of HIV infection.AIDS Res Ther. 2016 Apr 11;13:19. doi: 10.1186/s12981-016-0103-1. eCollection 2016. AIDS Res Ther. 2016. PMID: 27073405 Free PMC article. Review.
Cited by
-
Probiotics in Human Immunodeficiency Virus Infection: A Systematic Review and Evidence Synthesis of Benefits and Risks.Open Forum Infect Dis. 2016 Jul 29;3(4):ofw164. doi: 10.1093/ofid/ofw164. eCollection 2016 Oct. Open Forum Infect Dis. 2016. PMID: 27747250 Free PMC article. Review.
-
The gut microbiome and HIV-1 pathogenesis: a two-way street.AIDS. 2016 Nov 28;30(18):2737-2751. doi: 10.1097/QAD.0000000000001289. AIDS. 2016. PMID: 27755100 Free PMC article. Review.
-
A Summary of the First HIV Microbiome Workshop 2015.AIDS Res Hum Retroviruses. 2016 Oct/Nov;32(10-11):935-941. doi: 10.1089/AID.2016.0034. Epub 2016 Jul 14. AIDS Res Hum Retroviruses. 2016. PMID: 27267576 Free PMC article.
-
Control of commensal microbiota by the adaptive immune system.Gut Microbes. 2015;6(2):156-60. doi: 10.1080/19490976.2015.1031946. Gut Microbes. 2015. PMID: 25901893 Free PMC article. Review.
-
Enrichment of gut-derived Fusobacterium is associated with suboptimal immune recovery in HIV-infected individuals.Sci Rep. 2018 Sep 24;8(1):14277. doi: 10.1038/s41598-018-32585-x. Sci Rep. 2018. PMID: 30250162 Free PMC article.
References
-
- Ostrowski SR, Piironen T, Hoyer-Hansen G, Gerstoft J, Pedersen BK, et al. (2005) High plasma levels of intact and cleaved soluble urokinase receptor reflect immune activation and are independent predictors of mortality in HIV-1-infected patients. J Acquir Immune Defic Syndr 39: 23–31. - PubMed
-
- Brenchley JM, Price DA, Schacker TW, Asher TE, Silvestri G, et al. (2006) Microbial translocation is a cause of systemic immune activation in chronic HIV infection. Nat Med 12: 1365–1371. - PubMed
Publication types
MeSH terms
Substances
Grants and funding
LinkOut - more resources
Full Text Sources
Other Literature Sources
Medical

