

Unifying viral genetics and human transportation data to predict the global transmission dynamics of human influenza H3N2
- PMID: 24586153
- PMCID: PMC3930559
- DOI: 10.1371/journal.ppat.1003932
Unifying viral genetics and human transportation data to predict the global transmission dynamics of human influenza H3N2
Abstract
Information on global human movement patterns is central to spatial epidemiological models used to predict the behavior of influenza and other infectious diseases. Yet it remains difficult to test which modes of dispersal drive pathogen spread at various geographic scales using standard epidemiological data alone. Evolutionary analyses of pathogen genome sequences increasingly provide insights into the spatial dynamics of influenza viruses, but to date they have largely neglected the wealth of information on human mobility, mainly because no statistical framework exists within which viral gene sequences and empirical data on host movement can be combined. Here, we address this problem by applying a phylogeographic approach to elucidate the global spread of human influenza subtype H3N2 and assess its ability to predict the spatial spread of human influenza A viruses worldwide. Using a framework that estimates the migration history of human influenza while simultaneously testing and quantifying a range of potential predictive variables of spatial spread, we show that the global dynamics of influenza H3N2 are driven by air passenger flows, whereas at more local scales spread is also determined by processes that correlate with geographic distance. Our analyses further confirm a central role for mainland China and Southeast Asia in maintaining a source population for global influenza diversity. By comparing model output with the known pandemic expansion of H1N1 during 2009, we demonstrate that predictions of influenza spatial spread are most accurate when data on human mobility and viral evolution are integrated. In conclusion, the global dynamics of influenza viruses are best explained by combining human mobility data with the spatial information inherent in sampled viral genomes. The integrated approach introduced here offers great potential for epidemiological surveillance through phylogeographic reconstructions and for improving predictive models of disease control.
Conflict of interest statement
The authors have declared that no competing interests exist.
Figures
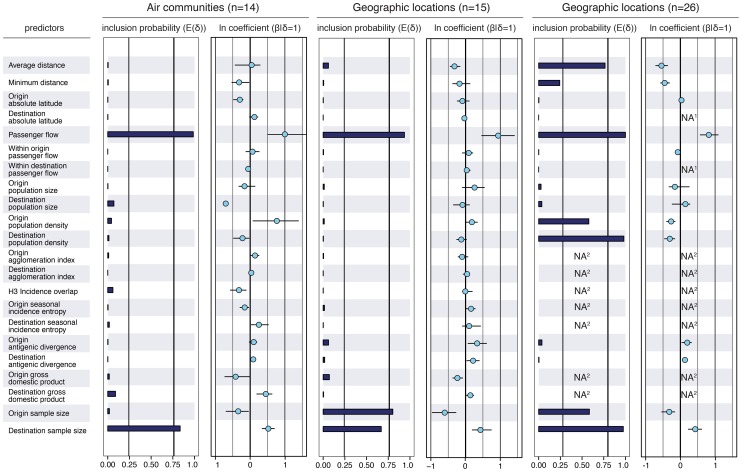
 because they reflect the frequency at which the predictor is included in the model and therefore represent the support for the predictor. Indicator expectations corresponding to Bayes factor support values of 10 and 100 are represented by a thin and thick vertical line respectively in these bar plots. The contribution of each predictor, when included in the model (
 ), where
  is the coefficient or effect size, is represented by the mean and credible intervals of the GLM coefficients on a log scale. NA1: no conditional effect size available because the predictor was never included in the model. We tested different population size and density measures, different incidence-based measures and different seasonal measures (Text S1), but only list the estimates for a representative predictor for the sake of clarity. The estimates for the full set of predictors are summarized for each sub-sampled data set in Fig. S5. NA2: no indicator expectation or conditional effect size available because the predictor was not available for this discretization of the sequence data.
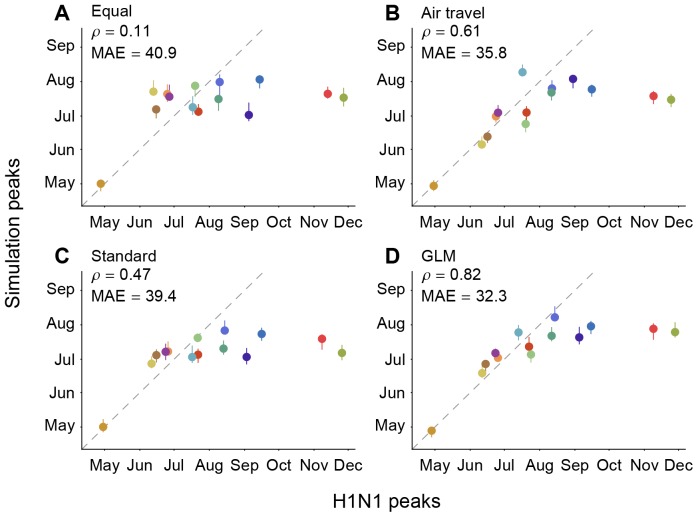
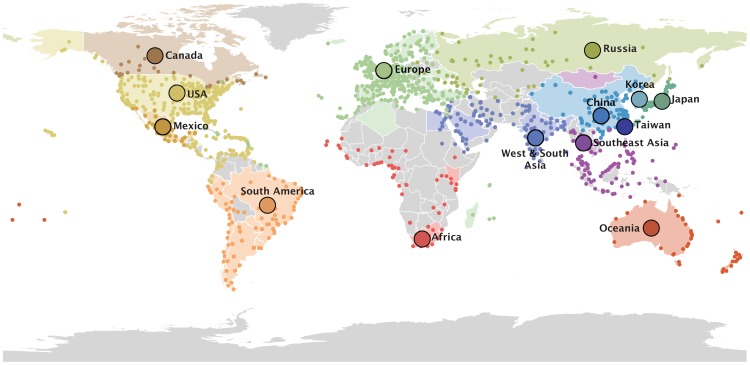
 ) and mean absolute error (MAE; in days) considering all locations except for Mexico are provided for each comparison. The data points are colored according to the air communities represented in Fig. 1. The dotted lines represent a 1-to-1 correspondence between observed peaks and simulated H1N1 peaks.
References
-
- Brockmann D, David V, Gallardo AM (2009) Human Mobility and Spatial Disease Dynamics. In: Diffusion Fundamentals III. Leipziger Universitätsverlag. pp. 55–81.
-
- Russell CA, Jones TC, Barr IG, Cox NJ, Garten RJ, et al. (2008) The global circulation of seasonal influenza a (H3N2) viruses. Science 320: 340–346. - PubMed
-
- Rvachev L, Longini IM (1985) A mathematical model for the global spread of influenza. Mathematical Biosciences 75: 3–22.
-
- Longini IM Jr, Fine PE, Thacker SB (1986) Predicting the global spread of new infectious agents. Am J Epidemiol 123: 383–91. - PubMed
Publication types
MeSH terms
Grants and funding
LinkOut - more resources
Full Text Sources
Other Literature Sources
Medical
