. 2014 Feb 27;10(2):e1003973.
doi: 10.1371/journal.ppat.1003973. eCollection 2014 Feb.

Structure of the membrane anchor of pestivirus glycoprotein E(rns), a long tilted amphipathic helix

Affiliations

Structure of the membrane anchor of pestivirus glycoprotein E(rns), a long tilted amphipathic helix

Daniel Aberle et al. PLoS Pathog. .

Abstract

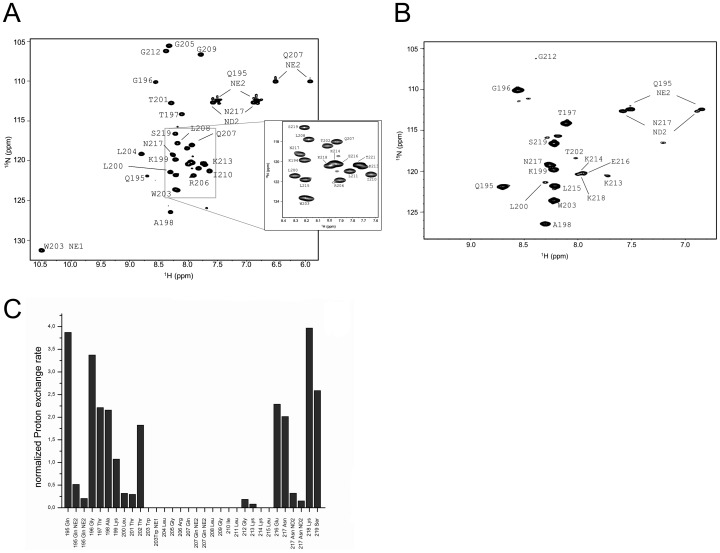
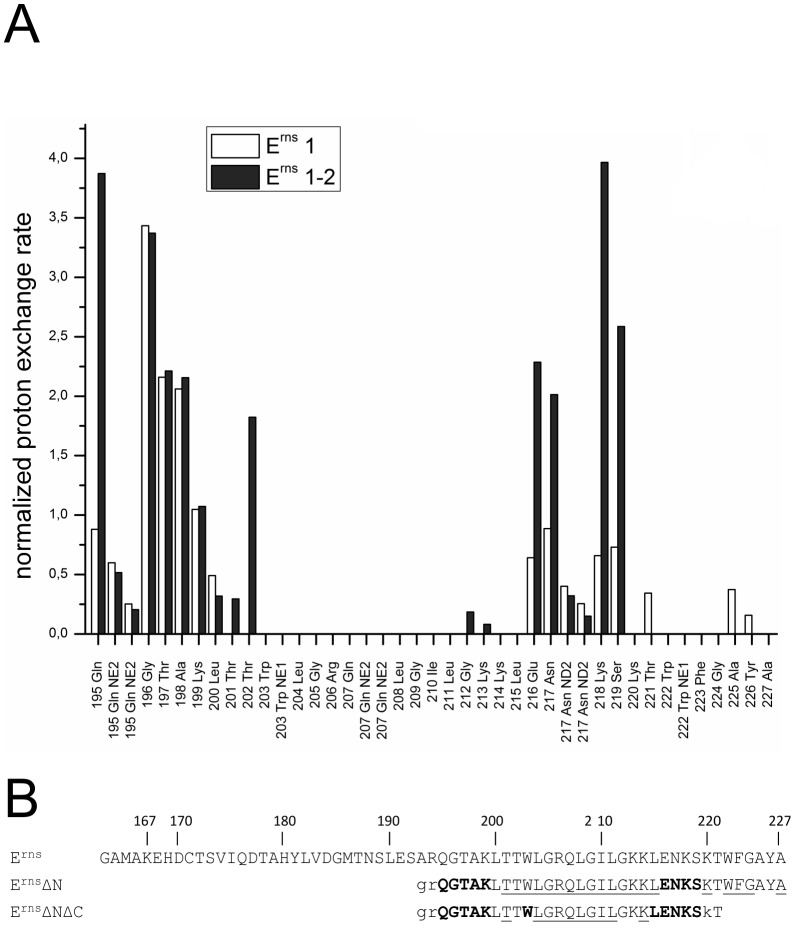
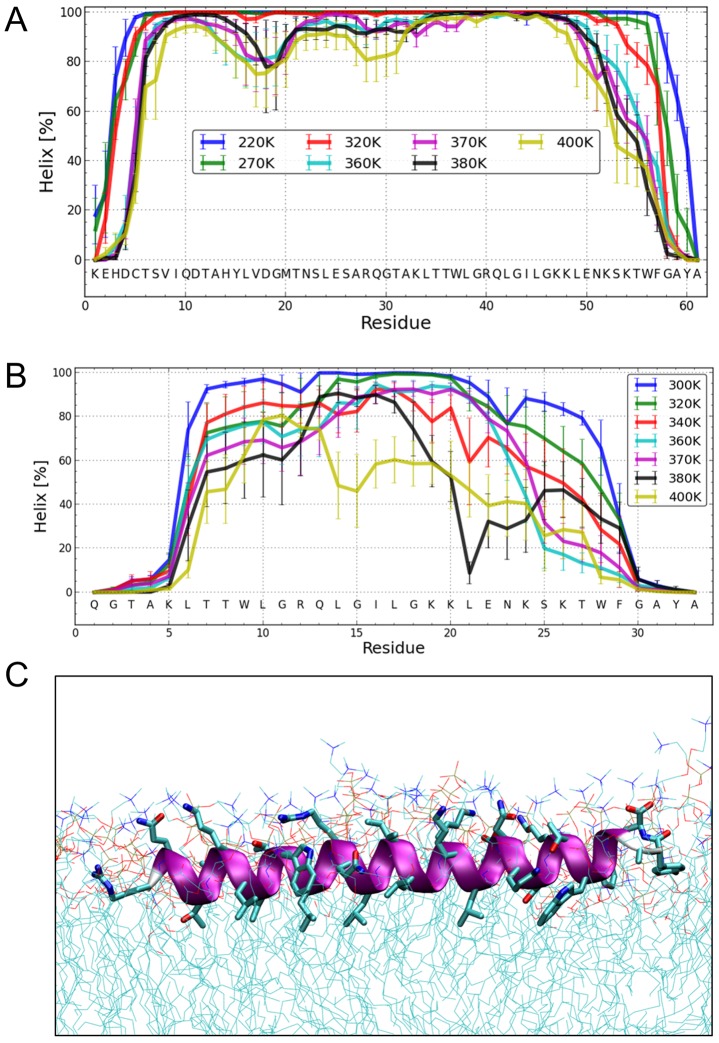
E(rns) is an essential virion glycoprotein with RNase activity that suppresses host cellular innate immune responses upon being partially secreted from the infected cells. Its unusual C-terminus plays multiple roles, as the amphiphilic helix acts as a membrane anchor, as a signal peptidase cleavage site, and as a retention/secretion signal. We analyzed the structure and membrane binding properties of this sequence to gain a better understanding of the underlying mechanisms. CD spectroscopy in different setups, as well as Monte Carlo and molecular dynamics simulations confirmed the helical folding and showed that the helix is accommodated in the amphiphilic region of the lipid bilayer with a slight tilt rather than lying parallel to the surface. This model was confirmed by NMR analyses that also identified a central stretch of 15 residues within the helix that is fully shielded from the aqueous layer, which is C-terminally followed by a putative hairpin structure. These findings explain the strong membrane binding of the protein and provide clues to establishing the E(rns) membrane contact, processing and secretion.


Conflict of interest statement

The authors have declared that no competing interests exist.

Figures

Figure 1
Figure 1. Amphipathic helix model of the Erns membrane anchor.
2D flat projection of the 3D structure of the Erns anchor (Lys167 – Ala227) assuming a continuous α-helical conformation. Positively charged amino acids are shown in dark blue (Arg, Lys), negatively charged ones in red (Asp, Glu), and hydrophobic amino acids are colored in yellow (Leu, Val, Ile, Met, Trp, Tyr, Phe, Ala, Cys). Polar amino acids are displayed in light blue (Thr, Asn, Ser, Gln, His), and the remaining ones (Gly, Pro) in green. The illustration was generated with the in-house software “Protein Origami” (Karlsruhe Institute of Technology, http://www.ibg.kit.edu/nmr/544.php).
Figure 2
Figure 2. CD and OCD spectra of the Erns C-terminus and the N-terminally truncated version ErnsΔN in different environments.
(A) CD spectra of the Erns membrane anchor (Lys167 – Ala227) in phosphate buffer at pH 6.5 (straight line), at pH 3 (dotted line), or in 50% TFE at pH 6.5 (dashed line). The results of the secondary structure analysis in these environments as well as in detergent micelles and lipoid vesicles are displayed in the inserted bar graph. The bars represent the mean helix content of the Erns anchor calculated with three secondary structure calculation programs (CDSSTR, CONTIN-LL and SELCON-3). (B) OCD spectra of the Erns membrane anchor (Lys167 – Ala227) in oriented lipid bilayers composed of DMPC (straight line), or a mixture of DMPC/DMPG (1∶1) (dotted line), each with a protein/lipid ratio of 1∶100. The spectra were normalized to the same intensity at ∼220 nm to illustrate the similarity in the lineshapes. (C) CD spectra of the Erns membrane anchor (Lys167 – Ala227) in DMPC/DMPG (1∶1) vesicles, recorded at protein/lipid ratios of 1∶20 (straight line), 1∶50 (dashed line), 1∶100 (dotted line), and 1∶200 (dashed-dotted line). (D) OCD spectra of the Erns membrane anchor (Lys167 – Ala227) in oriented lipid bilayers composed of a mixture of DMPC/DMPG (1∶1). The spectra were recorded at protein/lipid ratios of 1∶20 (straight line), 1∶50 (dashed line), and 1∶100 (dotted line). The spectra were normalized to the same intensity at ∼220 nm to illustrate the similarity in the lineshapes. (E) CD spectra of N-terminally truncated ErnsΔN (Arg194 – Ala227) in 50% TFE (dashed line), 10 mM DPC micelles (straight line), and bicelles composed of DHPC/DMPC (4∶1) (dotted line), at a protein/lipid ratio of 1∶100. The results of the secondary structure analysis in these environments are displayed in the inserted bar diagrams. The bars represent the mean helix content of ErnsΔN estimated with three secondary structure calculation programs (CDSSTR, CONTIN-LL and SELCON-3). (F) Comparison of the OCD spectra of the Erns membrane anchor (Lys167 – Ala227) and the N-terminally truncated ErnsΔN (Arg194 – Ala227) in oriented lipid bilayers composed of a mixture of DMPC/DMPG (1∶1) at a protein/lipid ratio of 1∶50. The spectra were normalized to the same intensity at ∼220 nm to allow for a better comparison of the lineshapes.
Figure 3
Figure 3. Water accessibility measurement of ErnsΔN.
(A) 15N-HSQC, and (B) CLEANEX spectra of N-terminally truncated ErnsΔN (Arg194 – Ala227) in bicelles composed of DHPC/DMPC (4∶1) at a protein/lipid ratio of 1∶222. NH cross peaks are labelled with the name of the amino acid in single letter code and its number according to the full-length Erns protein. The central part of the spectrum in (A) is blown up in the box on the right for better clarity. The side chain NH groups of Trp203 and 222 are marked as NE1. The Gln207 side chain, together with the side chains of Gln195 and Asn217 could not be further assigned and are therefore marked as NE2 or ND2. (C) Calculated normalized proton exchange rates of all identified NH groups in the spectra. The NH groups are labelled as in the NMR spectra.
Figure 4
Figure 4. Secondary structure prediction of ErnsΔN deduced from NMR spectroscopy.
(A) The measured HN-NH contact is displayed for each amino acid of ErnsΔN (Arg194 – Ala227) in the upper part of the figure to predict the secondary structure of the region. The CSI (chemical shift index) of Cα, HN and N determined by triple-resonance experiments for the protein backbone are shown for each amino acid in the middle part of the figure together with the resulting calculated secondary structure of TALOS (Torsion Angle Likelihood Obtained from Shift and sequence similarity) for each amino acid. The measured 15N longitudinal (R1) and transversal (R2) relaxation rates are displayed in the lower part of the figure as well as the heteronuclear NOE (het-NOE). (B) 1H-1H contacts of the C-terminal end of ErnsΔN (Arg194 – Ala227) that reveal steric proximity. The identified protons are labelled by their IUPAC nomenclature and by the corresponding amino acid and numbered according to the full-length Erns protein.
Figure 5
Figure 5. Water accessibility measurements of ErnsΔNΔC.
(A) 15N-HSQC, and (B) CLEANEX spectra of ErnsΔNΔC (Arg194 – Thr221), a 6 amino acid C-terminal truncated version of ErnsΔN, recorded in a bicelle system composed of DHPC/DMPC (4∶1) and a protein/lipid ratio of 1∶222. The 15N chemical shift is displayed on the y-axis and the 1H shift is shown on the x-axis. Identified NH groups are marked with the single letter code of the corresponding amino acids and numbered according to the full-length Erns protein. The central spectrum area in (A) is shown as a blow up in the box on the right for better clarity. The side chain NH groups of Trp203 and 222 are marked as NE1. The Gln207 side chain, together with the side chains of Gln195 and Asn217 could not be further assigned and are therefore marked as NE2 or ND2. (C) Calculated normalized proton exchange rates of all identified NH groups of the spectra. Lys220 and Thr221 could not be assigned unambiguously and therefore are not presented in the figure.
Figure 6
Figure 6. Comparison of the proton exchange rates of ErnsΔN and ErnsΔNΔC.
(A) Normalized proton exchange rates of ErnsΔN (Arg194 – Ala227) and of ErnsΔNΔC (Arg194 – Thr221) for all NH groups identified in the spectra (see Fig. 3C and 5C). (B) The amino acid sequences of the Erns membrane anchor (Erns), the N-terminally truncated protein ErnsΔN, and the N- and C-terminally truncated ErnsΔNΔC are numbered according to the full-length Erns protein. The amino acids of ErnsΔN and ErnsΔNΔC are displayed in different fonts depending on the value of the proton exchange rate of the corresponding peptide NH group. NH groups with a proton exchange rate above of 0.5 are shown in bold face, while those with a proton exchange rate below 0.5 are in standard font. The underlined amino acids were not detected in the CLEANEX spectrum and therefore do not show any significant proton exchange. Unassigned amino acids in the 15N-HSQC spectrum leading to a general lack of information about their water accessibility are presented in lower case.
Figure 7
Figure 7. Structure simulations.
(A) MC simulations in an implicit membrane model. Fraction of per-residue helical content at different simulation temperatures for Erns, as determined by the probability of finding a helical secondary structure element at the respective position. The value of the standard deviation is based on five trajectories per temperature. The simulations showed mostly helical conformations for about residues Thr172 to Lys218, whereas the terminal residues appear mostly disordered. (B) MC simulations in an implicit membrane model. Fraction of per-residue helical content at different simulation temperatures for ErnsΔN, as determined by the probability of finding a helical secondary structure element at the respective position. The value of the standard deviation is based on five trajectories per temperature. The simulations showed mostly helical conformations for residues Leu200 to Lys214, whereas the first five N-terminal residues are mostly disordered. With increasing temperature, the region between Leu215 and Phe223 partially unwinds and exhibits loop conformations followed by the helical C-terminus. (C) MD simulation of ErnsΔN (Arg194 – Ala227) at 72 ns in an explicit DMPC membrane. The protein shows a strong helical fold and lies slightly inclined in the hydrophobic region of the membrane just beneath the lipid head groups. The peptide was pulled from an equilibrated position in the membrane surface into the center of the membrane to mimic a more physiological starting position since at least part of the structure should be located within the membrane when the Erns C-terminus is generated by signal peptidase cleavage of the Erns/E1 precursor. In a free MD simulation following the pulling, the peptide exhibited a kink around residue 202 (not shown) until 40 ns, then the peptide was back to the original surface bound orientation and full helicity.

Similar articles

Cited by

References

    1. Lindenbach BD, Thiel HJ, Rice CM (2007) Flaviviridae: The Viruses and Their Replication. In: Knipe DM, Howley PM, editors. Fields Virology. Philadelphia, New York: Lippincott - Raven Publishers. pp. 1101–1152.
    1. Moennig V, Plagemann PG (1992) The pestiviruses. Advances in virus research 41: 53–98. - PubMed
    1. Thiel HJ, Plagemann PGW, Moennig V (1996) Pestiviruses. In: Fields BN, Knipe DM, Howley PM, editors. Fields Virology. Philadelphia, New York: Lippincott - Raven Publishers. pp. 1059–1073.
    1. Meyers G, Ege A, Fetzer C, von Freyburg M, Elbers K, et al. (2007) Bovine viral diarrhea virus: prevention of persistent fetal infection by a combination of two mutations affecting Erns RNase and Npro protease. Journal of virology 81: 3327–3338. - PMC - PubMed
    1. Seago J, Hilton L, Reid E, Doceul V, Jeyatheesan J, et al. (2007) The Npro product of classical swine fever virus and bovine viral diarrhea virus uses a conserved mechanism to target interferon regulatory factor-3. The Journal of general virology 88: 3002–3006. - PubMed

Publication types

Substances

LinkOut - more resources