. 2014 Feb 20;10(2):e1004120.
doi: 10.1371/journal.pgen.1004120. eCollection 2014 Feb.

Quantitative genome-wide genetic interaction screens reveal global epistatic relationships of protein complexes in Escherichia coli

Affiliations

Quantitative genome-wide genetic interaction screens reveal global epistatic relationships of protein complexes in Escherichia coli

Mohan Babu et al. PLoS Genet. .

Abstract

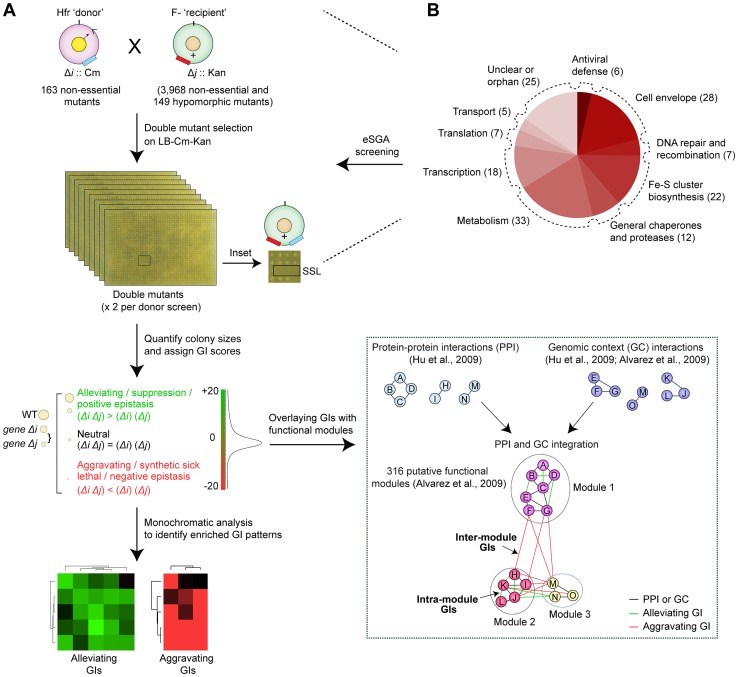
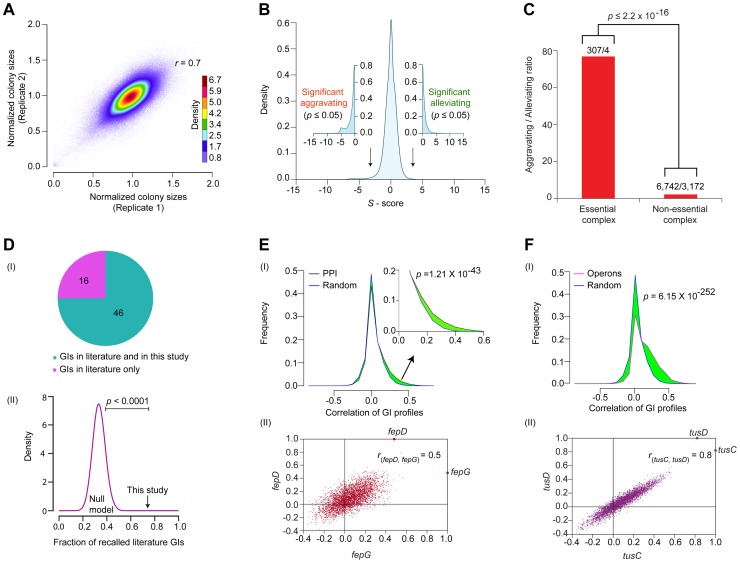
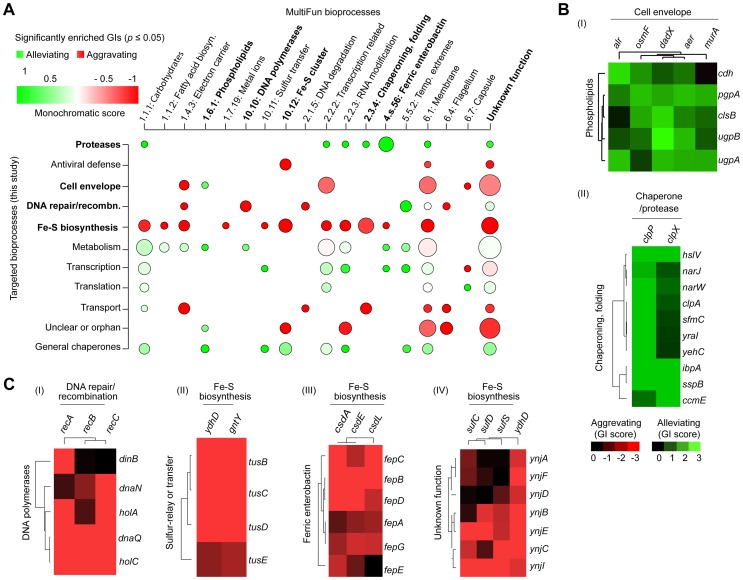
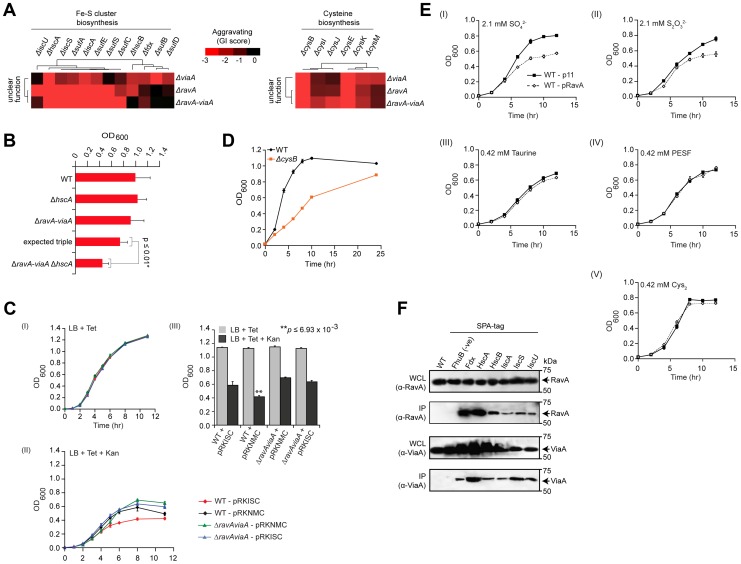
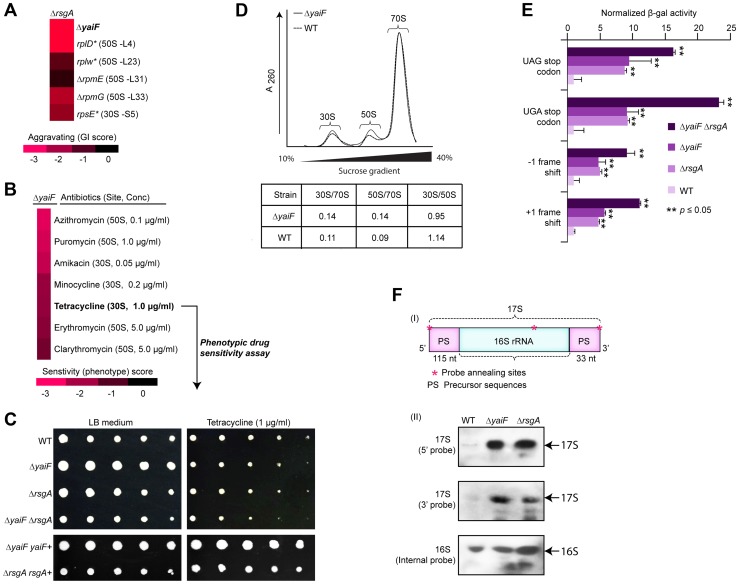
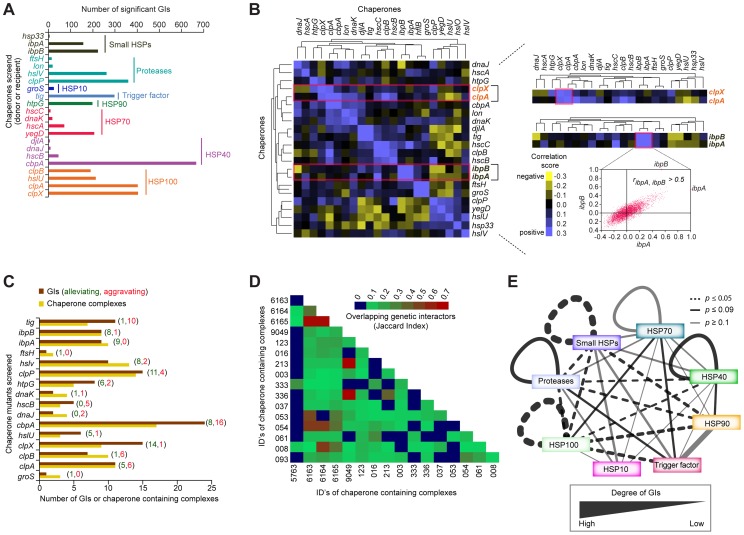
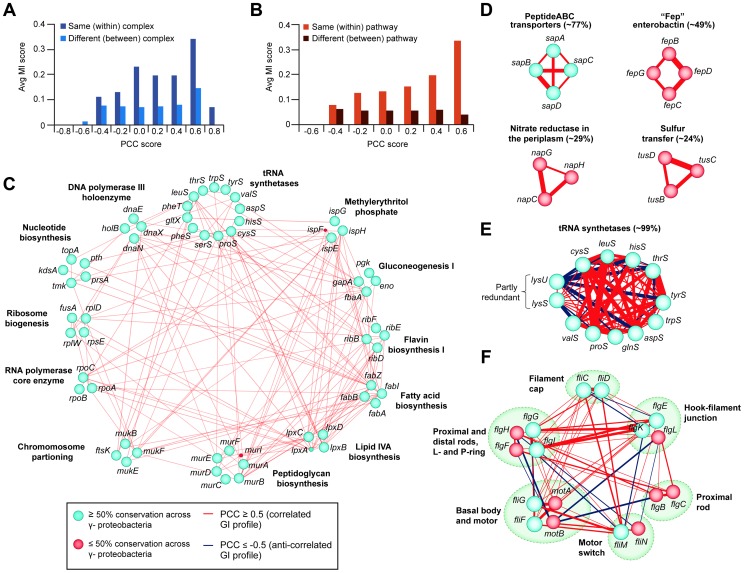
Large-scale proteomic analyses in Escherichia coli have documented the composition and physical relationships of multiprotein complexes, but not their functional organization into biological pathways and processes. Conversely, genetic interaction (GI) screens can provide insights into the biological role(s) of individual gene and higher order associations. Combining the information from both approaches should elucidate how complexes and pathways intersect functionally at a systems level. However, such integrative analysis has been hindered due to the lack of relevant GI data. Here we present a systematic, unbiased, and quantitative synthetic genetic array screen in E. coli describing the genetic dependencies and functional cross-talk among over 600,000 digenic mutant combinations. Combining this epistasis information with putative functional modules derived from previous proteomic data and genomic context-based methods revealed unexpected associations, including new components required for the biogenesis of iron-sulphur and ribosome integrity, and the interplay between molecular chaperones and proteases. We find that functionally-linked genes co-conserved among γ-proteobacteria are far more likely to have correlated GI profiles than genes with divergent patterns of evolution. Overall, examining bacterial GIs in the context of protein complexes provides avenues for a deeper mechanistic understanding of core microbial systems.


Conflict of interest statement

The authors have declared that no competing interests exist.

Figures

Figure 1
Figure 1. Target selection and eSGA screen pipeline.
(A) Schematic showing conjugation-based double mutant construction, colony imaging, and fitness scoring , . The GIs were subjected to monochromatic analysis to identify functionally related gene groups with similar GI patterns and overlaid with putative functional modules defined from PPI and GC-based networks , . (B) Bioprocess annotations and numbers (parenthesis) of functionally divergent query genes subjected to genome-wide eSGA screens.
Figure 2
Figure 2. Functional properties of the global E. coli GI network.
(A) Reproducibility of normalized colony sizes of digenic mutants measured in replicate screens. (B) Histogram of GI S-scores; arrows indicate cut-off scores (|S- score±3|; p-value ≤0.05 computed using Fisher's exact test) used to signify significant epistatic (aggravating or alleviating) interactions. (C) Comparison of aggravating-to-alleviating GI ratios observed among essential and non-essential complex components. Numbers represent the total aggravating over alleviating GIs in essential or non-essential complexes. (D) Overlap of GI compared to literature in terms of (I) coverage and (II) statistical significance (black arrow) versus background frequencies generated by random permutation (purple distribution represents 10,000 random null models). Distributions of GI correlation profiles (I) of genes either (E) encoding physically interacting proteins (zoom-in of right tail shown in inset) or (F) within same operon versus randomly drawn gene pairs; significance values computed using two-sample Kolmogorov-Smirnov (KS) test. (II) Representative scatter plots show correlated GI profiles of fepD (y-axis) vs. fepG (x-axis), and tusC (x-axis) vs. tusD (y-axis).
Figure 3
Figure 3. Monochromaticity of GIs among bacterial bioprocesses.
(A) Heatmap displaying the distribution of significantly enriched (p-value ≤0.05) aggravating or alleviating GIs between functional categories. Node size represents the number of enriched GIs per process, while the color indicates the monochromaticity type: red for aggravating (monochromatic score of −1) and green for alleviating (monochromatic score of +1). Only representative MultiFun processes (x-axis) are shown. Highlighted (bold) crosstalk processes are shown as separate sub-networks in panels B and C. Heatmaps showing overlapping patterns of alleviating (B) or aggravating (C) GIs for representative genes within particular categories after hierarchical clustering.
Figure 4
Figure 4. RavA and ViaA linked to Fe-S assembly.
(A) Sub-network of GIs of two unannotated genes with Fe-S cluster assembly and cysteine biosynthesis components. (B) Differential growth of select single, double and triple mutants in rich medium (LB) at 32°C over 24 h; expected fitness derived using multiplicative model, p-value calculated using Student's t-test. (C) Impact of ectopic over-expression of Isc Fe-S cluster assembly proteins (pRKISC expression plasmid vs. pRKNMC control empty vector) on growth of ravA-viaA double mutants vs. wild-type (WT) E. coli before (I) and after (II) oxidative stress (sub-lethal concentrations of kanamycin, Kan); OD600 readings at 11-hr time point (III) highlight differential responses. Tetracycline (Tet) included in media for plasmid maintenance. Asterisks represent significant (p≤0.01; Student's t-test) difference between WT+ pRKISC vs. WT+ pRKNMC. (D) Slow growth of cysB deletion mutants on liquid LB medium at 32°C. Each data point shows the mean ± SD (error bars) of three independent biological measurements. (E) Growth inhibition profiles of ectopic over-expression of ravA (pRavA) vs. WT (p11) on W-salt medium supplemented with sub-lethal concentration of inorganic (I and II) and organic (III–V) sources of sulphur. (F) Co-immunoprecipitation analysis of endogenous RavA (top) and ViaA (bottom). Immunoblots show chromosomally tagged Isc assembly proteins, expressed at native levels, in input whole cell lysate (WCL) and anti-FLAG immunoprecipitates (IP) as indicated. Untagged parental strain and an irrelevant bait protein (ATP-dependent iron hydroxamate transporter, FhuB), served as negative controls. Molecular masses (kDa) of marker proteins by SDS-PAGE are indicated.
Figure 5
Figure 5. YaiF linked to ribosome biogenesis.
(A) Aggravating GIs between yaiF and 30S subunit biogenesis factor, rsgA, and components of the 30S (rpsE) and 50S (rplD, rplW, rpmE, rpmG) ribosomes. (B) Drug hypersensitivity of a yaiF deletion strain to antibiotics targeting the ribosome/translational reported in a recent chemical-genetic screen . Drug concentration producing a significant phenotype is indicated in parentheses. (C) Sensitivity of yaiF and rsgA single and double mutants versus wild-type cells (WT) to tetracycline (1.0 µg/ml). Panel below shows phenotypic complementation by over-expression in trans. (D) Different ribosome profiles in yaiF deletion mutant vs. WT strains. Quantification of ribosome subunit peak ratios is provided. (E) Increased translational errors, based on read-through of a β-galactosidase reporter (normalized to a control vector), in yaiF and rsgA single and double mutants relative to WT cells. Asterisks indicate significant (Student's t-test) difference between single or double mutant vs. WT strains. (F) Schematic showing the precursor sequences (PS) of the 17S rRNA (I) with oligonucleotide probe annealing (shown as asterisks) sites. The 115 and 33 nucleotides shown in the 5′ and 3′ ends of the 17s rRNA is the precursor rRNA for 30S ribosomal subunit . Northern hybridization shows the accumulation of 17S rRNA species in mutants and WT strains (II) using the indicated biotinylated oligonucleotide probes. The 16S rRNA probe was used as an internal control.
Figure 6
Figure 6. Functional crosstalk among chaperones and proteases.
(A) Summary of chaperone type and GI frequency observed by eSGA. (B) Heatmap showing clusters of correlated GI profiles among select chaperones. Highlighted sub-networks show similar (correlated) GI profiles between the ATP-dependent protein unfoldases clpX and clpA (top), and the small HSPs ibpA and ibpB (bottom). Scatter-plot shows genome-wide correlation coefficient profiles of ibpA (x-axis) versus ibpB (y-axis). (C) Number of alleviating (green) or aggravating (red) GIs of each chaperone mutant (brown bar) with one or more chaperone-containing protein complexes (orange bar), compiled from Ecocyc and our own previous work . (D) Shared (jaccard index) non-chaperone interactors among chaperone-containing protein complexes. (E) Crosstalk among chaperone and protease families. Edge thickness represents degree of GI connectivity within and between families; dark edges indicate statistically significance (p-value ≤0.09; hypergeometric test).
Figure 7
Figure 7. Correlated GI profiles of co-conserved genes and modules.
(A) Distribution of MI and PCC score for E. coli gene pairs belonging to the same or different protein complexes, or (B) EcoCyc pathways. (C) Large interconnected clique of highly correlated (GI PCC score ≥0.5) and co-conserved (MI score ≥0.2 indicating high proportion of ortholog detected in γ-proteobacterial species) essential components of annotated bacterial pathways and complexes; classifications according to broad COG functional groupings. (D) Set of correlated co-conserved clusters specific to γ-proteobacteria (sap) or closely-related E. coli serotypes (fep, nap, tus). (E) Anti-correlated GI profiles between two partly redundant lysyl-tRNA synthetases (lysS, lysU) and other conserved tRNA determinants, and (F) between conserved components of bacterial flagellum complex. The percentage (E, F) indicates the average conservation of annotated complexes or pathways. Edge colors indicate GI profile similarity (red, correlated; dark blue, anti-correlated), edge width reflects gene-pair co-conservation (MI score), while node size or color indicates proportion of genes conserved in γ-proteobacteria or related species (blue, ≥50% conservation; red, ≤50% conservation).

References

    1. Babu M, Musso G, Diaz-Mejia JJ, Butland G, Greenblatt JF, et al. (2009) Systems-level approaches for identifying and analyzing genetic interaction networks in Escherichia coli and extensions to other prokaryotes. Mol Biosyst 12: 1439–1455. - PubMed
    1. Hu P, Janga SC, Babu M, Diaz-Mejia JJ, Butland G (2009) Global functional atlas of Escherichia coli encompassing previously uncharacterized proteins. PLoS Biol 7: e1000096. - PMC - PubMed
    1. Peregrin-Alvarez JM, Xiong X, Su C, Parkinson J (2009) The Modular Organization of Protein Interactions in Escherichia coli. PLoS Comput Biol 5: e1000523. - PMC - PubMed
    1. Moreno-Hagelsieb G, Collado-Vides J (2002) A powerful non-homology method for the prediction of operons in prokaryotes. Bioinformatics 18 Suppl 1: S329–336. - PubMed
    1. Salgado H, Moreno-Hagelsieb G, Smith TF, Collado-Vides J (2000) Operons in Escherichia coli: genomic analyses and predictions. Proc Natl Acad Sci U S A 97: 6652–6657. - PMC - PubMed

Publication types

Substances

LinkOut - more resources