. 2014 Feb 20;10(2):e1004151.
doi: 10.1371/journal.pgen.1004151. eCollection 2014 Feb.

Natural polymorphisms in Tap2 influence negative selection and CD4∶CD8 lineage commitment in the rat

Affiliations

Natural polymorphisms in Tap2 influence negative selection and CD4∶CD8 lineage commitment in the rat

Jonatan Tuncel et al. PLoS Genet. .

Abstract

Genetic variation in the major histocompatibility complex (MHC) affects CD4∶CD8 lineage commitment and MHC expression. However, the contribution of specific genes in this gene-dense region has not yet been resolved. Nor has it been established whether the same genes regulate MHC expression and T cell selection. Here, we assessed the impact of natural genetic variation on MHC expression and CD4∶CD8 lineage commitment using two genetic models in the rat. First, we mapped Quantitative Trait Loci (QTLs) associated with variation in MHC class I and II protein expression and the CD4∶CD8 T cell ratio in outbred Heterogeneous Stock rats. We identified 10 QTLs across the genome and found that QTLs for the individual traits colocalized within a region spanning the MHC. To identify the genes underlying these overlapping QTLs, we generated a large panel of MHC-recombinant congenic strains, and refined the QTLs to two adjacent intervals of ∼0.25 Mb in the MHC-I and II regions, respectively. An interaction between these intervals affected MHC class I expression as well as negative selection and lineage commitment of CD8 single-positive (SP) thymocytes. We mapped this effect to the transporter associated with antigen processing 2 (Tap2) in the MHC-II region and the classical MHC class I gene(s) (RT1-A) in the MHC-I region. This interaction was revealed by a recombination between RT1-A and Tap2, which occurred in 0.2% of the rats. Variants of Tap2 have previously been shown to influence the antigenicity of MHC class I molecules by altering the MHC class I ligandome. Our results show that a restricted peptide repertoire on MHC class I molecules leads to reduced negative selection of CD8SP cells. To our knowledge, this is the first study showing how a recombination between natural alleles of genes in the MHC influences lineage commitment of T cells.


Conflict of interest statement

The authors have declared that no competing interests exist.

Figures

Figure 1
Figure 1. Genetic mapping in heterogeneous stock (HS) rats.
(A) Genome scans of the CD4∶CD8 ratio (green), and the surface expression of MHC class I (MHC-I, red) and MHC class II (MHC-II, blue). The vertical axis shows the negative log P value for the 20 autosomes. Note that the left and right axis show −log P values for different phenotypes. Q1–Q10 indicate significant QTLs. (B) Close-up for Q8–Q10 on chromosome 20 showing the approximate location of the MHC region. (C) Position (in megabases, Mb) of peak marker (Pos.), confidence intervals (CI) in Mb, and effect sizes (%) of the peak markers in the QTLs shown in (A). The RMIP value is a measure of the probability that the loci are correctly identified (max = 1.0).
Figure 2
Figure 2. Physical map of the rat MHC region.
The map was constructed according to the NCBI build 3.4 genome assembly. Genes (left) are depicted according to scale (positions in Mb), except for positions indicated with crotchets. The gross organization of MHC-Ia, II, III and Ib -regions are adopted from Hurt et al. . Recombinant congenic strains are shown as gray vertical bars with dashed lines representing congenic borders (intervals of unknown genotype). Markers, short tandem repeats (STRs) and single nucleotide polymorphisms (SNPs), are shown in italic numbers. Numbers with asterisks at the top and bottom of the figure represent the position of the closest negative (DA) marker. Genes in Tcs1 are red and in Tcs2 blue (see box for definitions). Inset shows the organization of the human (HLA) and rat (RT1) MHC regions. Non-recombinant congenic strains, which have fragments spanning the entire MHC region, are not shown. xMHC-II, extended MHC class II region; xMHC-I, extended MHC class I region.
Figure 3
Figure 3. Recombination hotspots and haplotype blocks in the rat MHC.
Recombination activity was assessed over 2(3.4–5.4 Mb). Blue lines represent cold regions (haplotype blocks) with low recombination activity. Regions with recombinations are depicted as red bars. The width of the bars, and the table inset (right), represent recombination intervals. Numbers above bars in bold face represent the observed numbers of recombinations within the interval with the number of analyzed meiotic events shown below. The height of the bars indicate individuals with recombinations (in %). Blue triangles represent recombination hotspots in humans and are adopted from Cullen et al. .
Figure 4
Figure 4. Coding variants in T cell selection QTL 2 (Tcs2).
Nonsynonymous- and structural variants in Tcs2 were determined by Sanger sequencing of DA.1F (f), DA (a), DA.1I (i), DA.1U (u) and DA.1H (h) (see also Table 2). Amino acid substitutions are indicated in standard single letter codes and insertions/deletions as DEL. Gene annotations are from UniProt; protein domains depicted in DOb are derived from the human homolog. Letters in boxes depict residues with background allele (DA) with numbers above indicating amino acid positions in the translated cds. On top is a schematic illustration of the genes in the region according to the 3.4 genome assembly (genes outside the QTL are shown in gray). Annotations used: TM, transmembrane domain; CD, cytoplasmic domain; CP, connecting peptide; β1, beta 1 domain; β2, beta 2 domain; α1, alpha 1 domain; α2, alpha 2 domain. *Residues associated with class-I modification (cim).
Figure 5
Figure 5. Regulation of class I expression by classical and inverse cim.
(A) CD68+ cells were stained on the cell surface with OX18 (anti-class Ia and Ib). Histograms show representative samples from DA, DA.1H and DA.1H derived strains with different alleles of RT1-A and Tap2 as stated on top. Data from all individuals are shown in scatterplot (far right); * significant compared to DA.1H (1H); ** significant compared to DA. (B) CD68+ cells stained with a class Ia specific antibody (F16-4-4). (C) T cells from animals shown in (A) stained intracellularly with OX18 (scatterplot) and F16-4-4 (histogram). (D–E) Subsets of leukocytes from DA and DA.1IR85 spleen stained extracellularly (D) and intracellularly (E) with OX18. Data are representative of 6 individuals per group. (F) Surface expression of MHC class I (OX18) on CD68+ cells from DA and DA.1U congenic strains. (G) CD68+ cells (same as in F) stained with F16-4-4. Vertical lines in scatterplots show mean values. Representative results of at least two independent experiments are shown.
Figure 6
Figure 6. Transcriptional regulation of MHC class I genes.
(A) Allele-specific primers (Prim.) used for quantitative RT-PCR showed minimal amplification of other RT1-A alleles and were therefore considered class Ia-specific (i.e. not cross-reacting to class Ib genes); PCR products (Prod.) are shown for DA (a), DA.1UR83 (u), DA.1HR83 (h) and DA.1IR85 (i). (B) Expression in spleen of RT1-A genes in DA and Tcs1-congenic strains relative to the expression of beta-2-microglobuline (B2M). (C) Variation (fold-change) in RT1-A gene expression between different congenic strains. Data show the mean expression of 2–4 different primer sets per target gene after normalization to 3 reference genes (Table S3). Significant differences compared to RT1-Aa. (D) Expression of RT1-Aa (class Ia) and clone 3.6 (class Ib) in spleen from DA rats. The amplification of a product in DA.1HR83 but not in DA.1H (1H) indicates that the primers for clone 3.6 are not cross-reacting to the RT1-Aa gene in DA (adjacent figure).
Figure 7
Figure 7. Tcs1 and Tcs2-congenic strains show similar variation in extracellular MHC expression in thymus and spleen.
(A) Thymic conventional DCs (CD103+, CD11b/c+) stained extracellularly for class I (OX18). Scatterplots show results from two different experiments with Tcs1 and Tcs2-congenic strains. The variation between the strains is comparable to data shown in Figure 5 for CD68+ cells. (B–C) Splenic DCs (CD103+, CD68+, CD11b/c+) (B) and thymic DCs (C) stained extracellularly for RT1-D (OX17) and RT1-B (OX6). Histograms show representative samples from DA (solid lines) and DA.1HR10 (dashed lines).
Figure 8
Figure 8. Class-I modification reduces negative selection of CD8 cells.
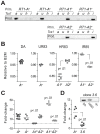
(A) The QTLs in Tcs1 and Tcs2 did not affect the total number of double negative cells (DN; CD4−, CD8b−). B cells (CD45RA+) were excluded from the DN gate. (B) DN cell maturation is defined by CD45RC and CD2 (see Fig. S10). DN cells in DA.1FR9 showed a lower frequency of early thymic precursors (ETP) compared to DA. Counter plot shows gating strategy with numbers indicating percent (%) of parent population (stated above plot). (C) Counter plot shows CD45RC−, CD2hi DN cells from DA.1UR83, and scatter plots the frequency of TCRβ− and TCRβ+ (DN4 in mouse) cells in DA and DA.1UR83. (D) Thymi from Tcs2-congenic strains with TAP-B (HR10 and UR10) contained fewer double positive (DP) cells but more cells (in %) with high TCR expression. (E) TAP-B strains (HR10 and UR10) showed higher frequencies (histograms) and total numbers (scatter plots) of CD8 single positive (SP) cells with high TCR expression. Numbers (%) in histograms represent mean-values ±SD of cells with high TCR expression (gated, n = 5). (F) Frequencies (histograms; n = 5) and total numbers (scatter plot) of CD8SP cells with high TCR expression in DA.1H (RT1-Ah, TAP-B) and in strains with low levels of surface MHC class I (HR83 [RT1-Ah, TAP-A] and IR85 [RT1-An, TAP-A]). (G) Virtually all CD4SP cells express high levels of TCR. Histogram shows expression of TCR on CD4SP thymocytes in DA (n = 5). Scatterplot shows total number of CD4SP cells per thymus in Tcs2-congenic strains.
Figure 9
Figure 9. Classical cim influences the number of CD8 recent thymic emigrants.
(A) Recent thymic emigrants (RTEs) express CD90 and low levels of CD45RC. Counterplots show CD8 RTEs (gated) in the spleen of 6.5-week old congenic and DA rats (representative samples, numbers in gates show percent of CD8 T cells). Scatterplot shows total number of CD8 RTEs per spleen, which correlates to the absolute number of CD8SP TCRhi cells in the thymi from the same animals (far right). (B) The corresponding staining (as shown in A) for CD4 RTEs, including total numbers (scatterplot) and correlation to CD4SP TCRhi cells in the thymus. (C) Absolute numbers of CD4 (blue) and CD8 (red) T cells in the spleen of 13-week old rats. Strains and genotypes are shown above and below graphs, respectively; n = 5–7 per group.

Similar articles

Cited by

References

    1. Flajnik MF, Kasahara M (2001) Comparative genomics of the MHC: glimpses into the evolution of the adaptive immune system. Immunity 15: 351–362. - PubMed
    1. Complete sequence and gene map of a human major histocompatibility complex. The MHC sequencing (1999) Complete sequence and gene map of a human major histocompatibility complex. The MHC sequencing consortium. Nature 401: 921–923 doi:10.1038/44853 - DOI - PubMed
    1. Trowsdale J, Knight JC (2013) Major histocompatibility complex genomics and human disease. Annu Rev Genomics Hum Genet 14: 301–323 doi:10.1146/annurev-genom-091212-153455 - DOI - PMC - PubMed
    1. Fernando MMA, Stevens CR, Walsh EC, De Jager PL, Goyette P, et al. (2008) Defining the role of the MHC in autoimmunity: a review and pooled analysis. PLoS Genet 4: e1000024 doi:10.1371/journal.pgen.1000024 - DOI - PMC - PubMed
    1. Gabriel SB, Schaffner SF, Nguyen H, Moore JM, Roy J, et al. (2002) The structure of haplotype blocks in the human genome. Science 296: 2225–2229 doi:10.1126/science.1069424 - DOI - PubMed

Publication types

MeSH terms

Substances