. 2014 Feb 27;10(2):e1004156.
doi: 10.1371/journal.pgen.1004156. eCollection 2014 Feb.

A variant in the neuropeptide receptor npr-1 is a major determinant of Caenorhabditis elegans growth and physiology

Affiliations

A variant in the neuropeptide receptor npr-1 is a major determinant of Caenorhabditis elegans growth and physiology

Erik C Andersen et al. PLoS Genet. .

Erratum in

  • PLoS Genet. 2014 Mar;10(3):e1004316

Abstract

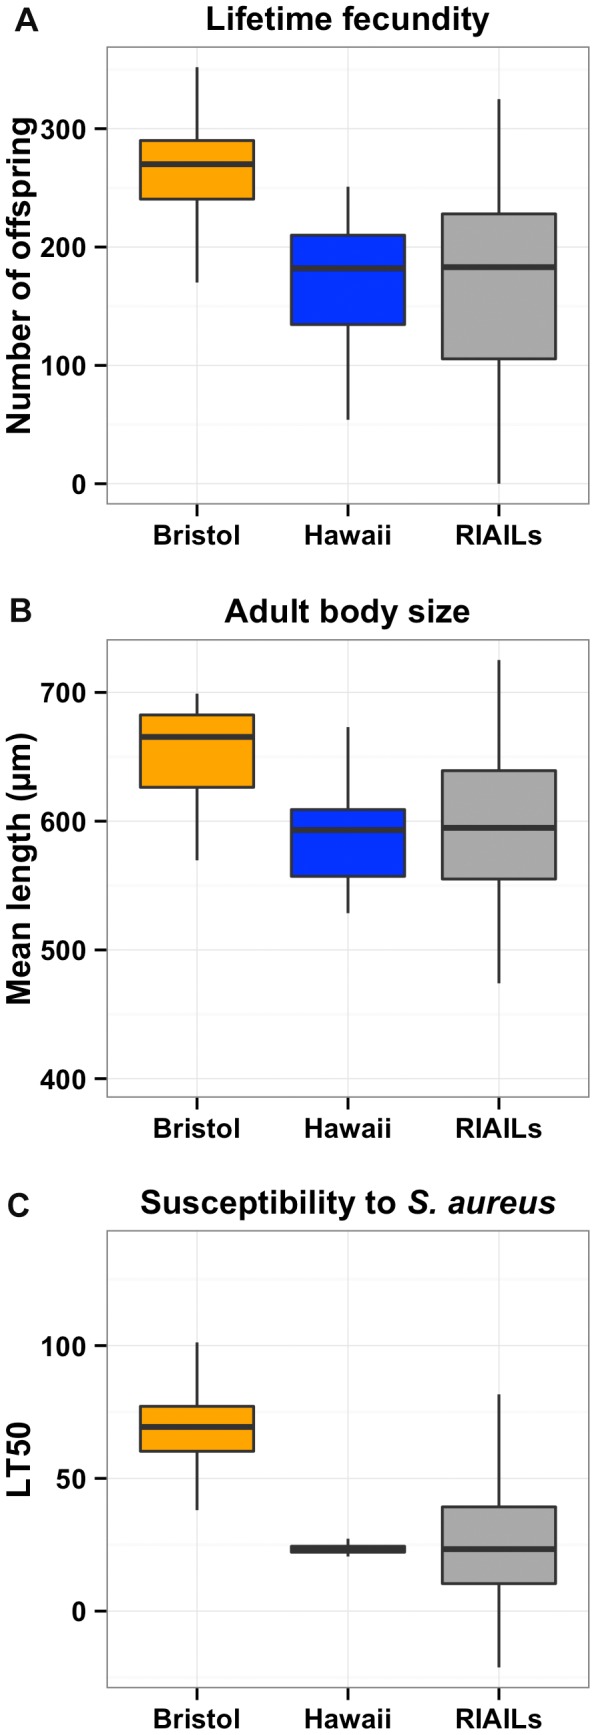
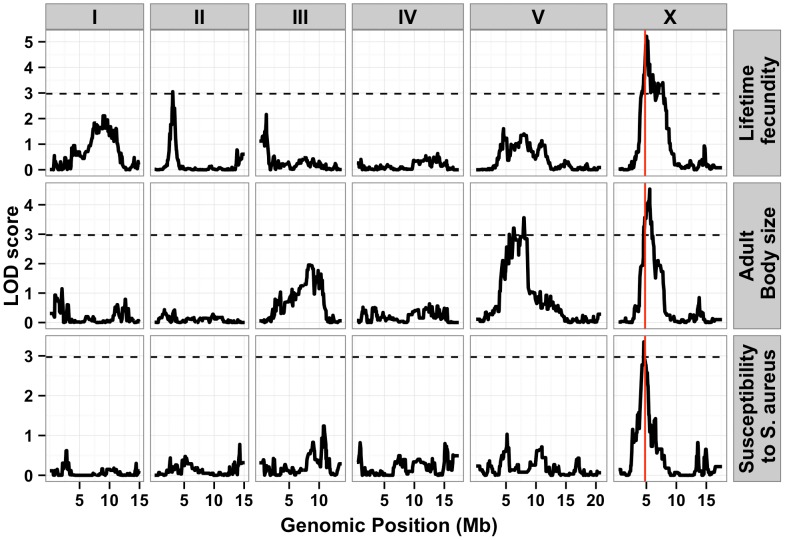
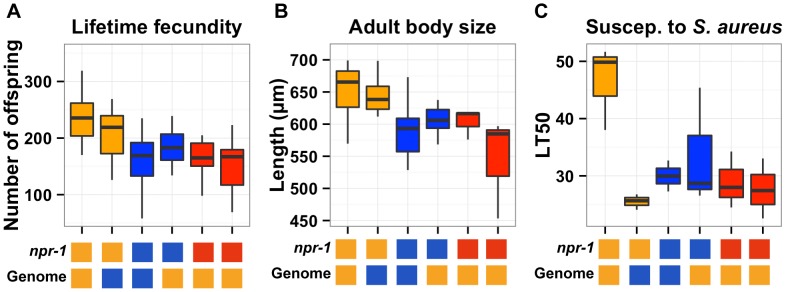
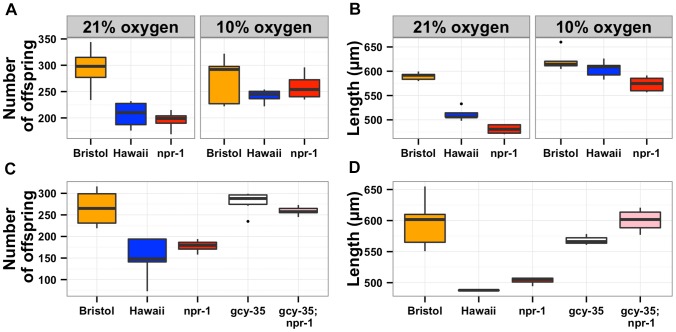
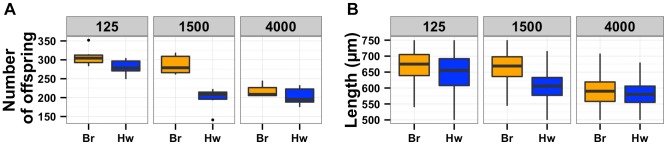
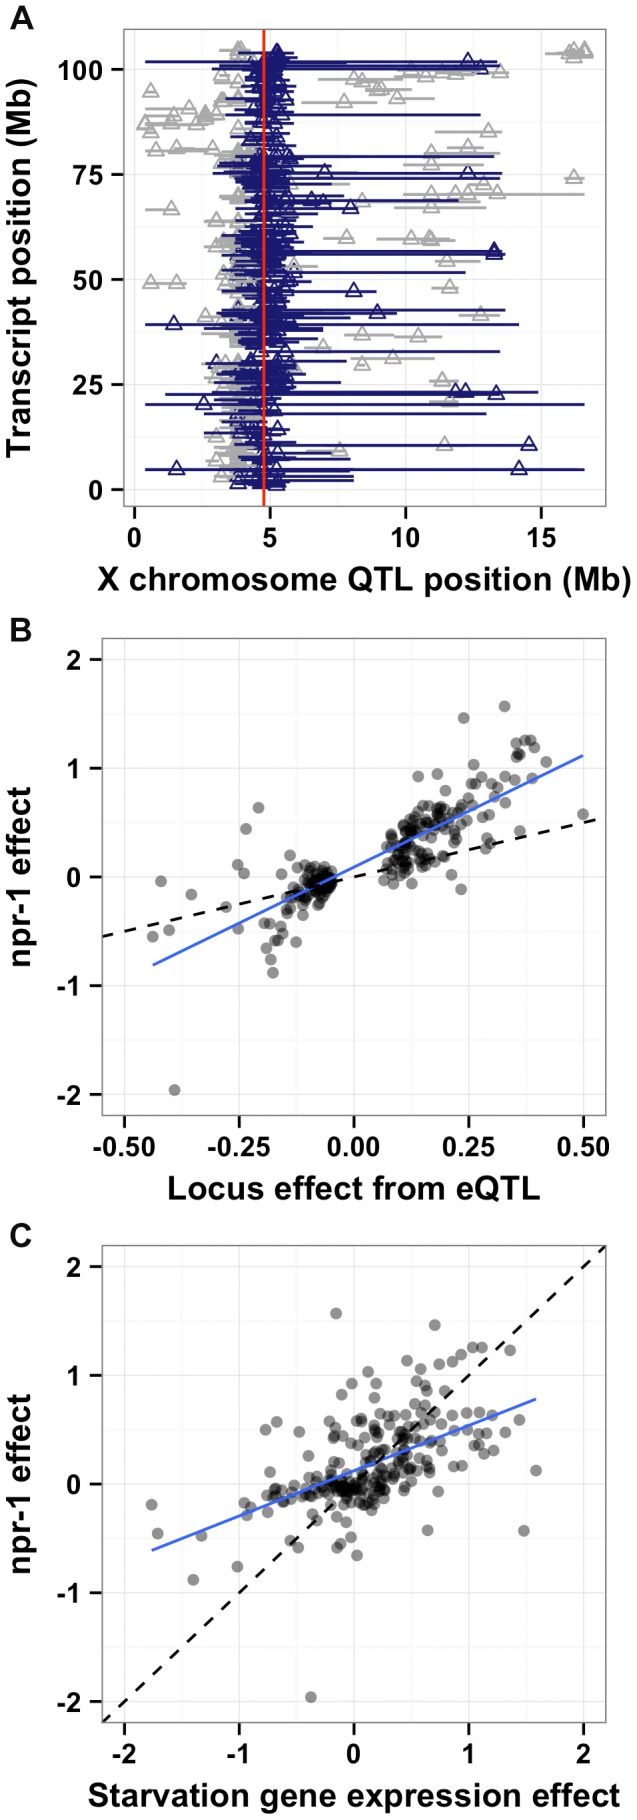
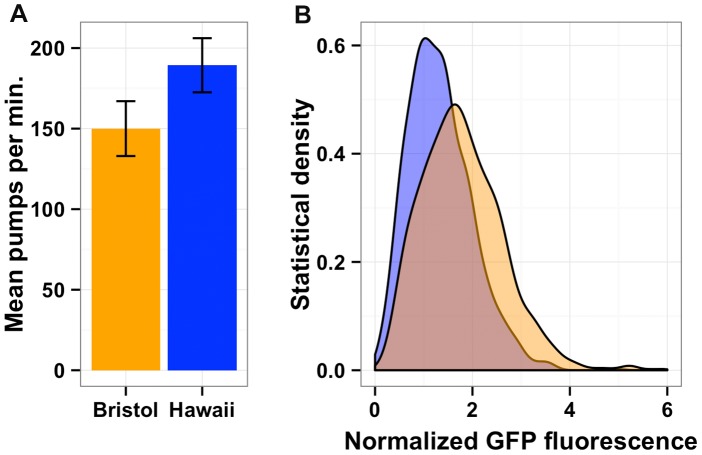
The mechanistic basis for how genetic variants cause differences in phenotypic traits is often elusive. We identified a quantitative trait locus in Caenorhabditis elegans that affects three seemingly unrelated phenotypic traits: lifetime fecundity, adult body size, and susceptibility to the human pathogen Staphyloccus aureus. We found a QTL for all three traits arises from variation in the neuropeptide receptor gene npr-1. Moreover, we found that variation in npr-1 is also responsible for differences in 247 gene expression traits. Variation in npr-1 is known to determine whether animals disperse throughout a bacterial lawn or aggregate at the edges of the lawn. We found that the allele that leads to aggregation is associated with reduced growth and reproductive output. The altered gene expression pattern caused by this allele suggests that the aggregation behavior might cause a weak starvation state, which is known to reduce growth rate and fecundity. Importantly, we show that variation in npr-1 causes each of these phenotypic differences through behavioral avoidance of ambient oxygen concentrations. These results suggest that variation in npr-1 has broad pleiotropic effects mediated by altered exposure to bacterial food.


Conflict of interest statement

The authors have declared that no competing interests exist.

Figures

Figure 1
Figure 1. Phenotypic distributions of three quantitative traits for the Bristol and Hawaii parents along with the RIAILs.
Box plots show the phenotypic distributions of the two parents (Bristol in orange and Hawaii in blue) and the recombinant inbred lines (RIAILs, dark gray) for lifetime fecundity (A), the length of adult animals (B), and the LT50 distribution after exposure to S. aureus (C). For each comparison between Bristol and Hawaii, the phenotypes are significantly different by Tukey's HSD with each p-value less than 2E-16.
Figure 2
Figure 2. Linkage mapping results for lifetime fecundity, adult body size, and susceptibility to S. aureus.
Linkage mapping results of the three traits are shown with genomic position (Mb) on the x-axis and LOD score on the y-axis. Each chromosome is in its own box labeled on top of the box. From top to bottom, the traits mapped are the lifetime fecundity, the mean length of adult animals, and the LT50 after exposure to S. aureus. The number of recombinant inbred lines (RIAILs) phenotyped are shown on the left of each plot. The dotted lines are the significance thresholds (genome-wide false positive rate of 0.05). The vertical red line is the position of the gene npr-1.
Figure 3
Figure 3. Phenotypic distributions of three quantitative traits for the parents, nearly isogenic lines, and npr-1 mutants.
Box plots show the summary phenotype data of the two parents (Bristol in orange and Hawaii in blue), the two nearly isogenic lines (kyIR9 in orange and qgIR1 in blue), and the two independent npr-1 loss-of-function alleles (npr-1(ad609) and npr-1(ky13) in red). From left to right, the lifetime fecundity (A), the mean length of adult animals (B), and the LT50 distribution after exposure to S. aureus (C). Below each plot are two boxes. The top box denotes the npr-1 genotype: laboratory-derived NPR-1V from Bristol in orange, ancestral wild-type NPR-1F from Hawaii in blue, or loss-of-function allele from Bristol in red. The bottom box denotes the genome-wide genotype: Bristol in orange and Hawaii in blue. Statistical significance was tested using Tukey's HSD. For (A), the qgIR1 strain has significantly fewer offspring than the Bristol strain (p = 0.003) does, and the kyIR9 strain has significantly more offspring than the Hawaii strain (p = 0.0059) does. The Hawaii strain, qgIR1, and the two npr-1 loss-of-function alleles do not have significantly different numbers of offspring. The same is true for the Bristol strain and kyIR9. For (B), the qgIR1 strain is significantly smaller than the Bristol strain (p = 0.00148), and the kyIR9 strain is significantly larger than the Hawaii strain (p = 6E-5). The Hawaii strain, qgIR1, and the two npr-1 loss-of-function alleles do not have significantly different lengths. The same is true for the Bristol strain and kyIR9 introgression strain.
Figure 4
Figure 4. The effects of aerotaxis behaviors on lifetime fecundity and adult body size.
The oxygen avoidance behavior mediated by npr-1 is necessary for alterations in lifetime fecundity (A) and adult body size (B). The box plots show summary data from assays performed at 21% ambient oxygen (left) versus 10% oxygen (right). At 10% oxygen, the Hawaii strain no longer clumps and borders instead spreading out across the entire surface of the agar plate while consuming bacterial food. At this lower oxygen level, the Hawaii strain and a npr-1 loss-of-function allele do not have statistically different lifetime fecundities (p = 0.37 and p = 0.07) from the Bristol strain. Adult body size is not significantly different between Bristol and Hawaii (p = 0.31) but is different between Bristol and npr-1(ad609) (p = 0.003). However, the large increase in adult body size by oxygen concentration suggests that clumping largely influences this trait. A mutation that causes failure to sense oxygen, gcy-35(ok769), suppresses the lifetime fecundity (C) and adult body size (D) defects of npr-1(ad609). The double mutant gcy-35(ok769); npr-1(ad609) has significantly more offspring than the npr-1(ad609) single mutant (p = 0.005) and grows significantly larger than the npr-1(ad609) single mutant (p = 0.0001). All statistical significance was assessed by Tukey's HSD test.
Figure 5
Figure 5. Population density directly impacts lifetime fecundity and adult body size.
Box plots for Bristol (orange) and Hawaii (blue) strains are shown for low, normal, and high densities of 125, 1500, or 4000 animals per 10 cm agar plate, respectively. (A) Decreased culture density caused a significant increase in fecundity (p = 1.3E-4) of the Hawaii strain from 198 to 280 offspring. By contrast, increased culture density did not cause a significant difference (p = 0.95) in fecundity of the Hawaii strain. (B) Decreased culture density (125 vs. 1500 animals) caused a significant increase in adult body size (p = 2E-16) of the Hawaii strain from 606 µm to 649 µm. By contrast, increased culture density (4000 vs. 1500 animals) caused a significant decrease (p = 2E-16) in adult body size of the Hawaii strain from 606 µm to 583 µm.
Figure 6
Figure 6. npr-1 underlies many expression QTL and could cause chronic low-level starvation. (A)
The physical positions of gene expression QTL 95% confidence intervals on the X chromosome (Mb) on the x-axis are plotted against the physical genomic location of the transcript (Mb) on the y-axis. Triangles indicate the position of the maximum LOD score for that QTL. Blue horizontal bars denote confidence intervals that overlap with the physical position of npr-1 (shown as a red vertical line). Gray horizontal bars denote confidence intervals that do not overlap with the physical position of npr-1. (B) Scatterplot of the locus effect from the eQTL mapping versus the effect of npr-1 for the 247 genes with eQTL confidence intervals overlapping npr-1. Each point represents a transcript. The blue line is the best fit by linear regression. The dotted black line indicates y = x. The slope of the regression line is 1.82 (95% CI 1.72–1.91) with a correlation of 0.83 (59% variance explained). (C) Scatterplot of the effect of starvation versus the effect of npr-1 for the 247 genes with eQTL confidence intervals overlapping npr-1. Symbols and lines as in (B). The slope of the regression line is 0.76 (95% CI 0.68–0.84) with a correlation of 0.61 (28% variance explained).
Figure 7
Figure 7. Bacterial food consumption differs between the Bristol and Hawaii strains.
(A) Average pharynx pumps per minute for Bristol (orange) and Hawaii (blue) are shown and are significantly different by Tukey's HSD test (p = 2E-16). (B) Both the Bristol and Hawaii strain were fed E. coli bacteria expressing GFP (HB101-GFP) for two hours. The statistical density of green fluorescence normalized by length is shown for Hawaii (blue) and Bristol (orange).

References

    1. Rockman MV, Skrovanek SS, Kruglyak L (2010) Selection at linked sites shapes heritable phenotypic variation in C. elegans. Science 330: 372–376 doi:10.1126/science.1194208 - DOI - PMC - PubMed
    1. Seidel HS, Ailion M, Li J, van Oudenaarden A, Rockman MV, et al. (2011) A novel sperm-delivered toxin causes late-stage embryo lethality and transmission ratio distortion in C. elegans. Plos Biol 9: e1001115 doi:10.1371/journal.pbio.1001115 - DOI - PMC - PubMed
    1. Seidel HS, Rockman MV, Kruglyak L (2008) Widespread genetic incompatibility in C. elegans maintained by balancing selection. Science 319: 589–594 doi:10.1126/science.1151107 - DOI - PMC - PubMed
    1. Ghosh R, Andersen EC, Shapiro JA, Gerke JP, Kruglyak L (2012) Natural variation in a chloride channel subunit confers avermectin resistance in C. elegans. Science 335: 574–578 doi:10.1126/science.1214318 - DOI - PMC - PubMed
    1. Bendesky A, Tsunozaki M, Rockman MV, Kruglyak L, Bargmann CI (2011) Catecholamine receptor polymorphisms affect decision-making in C. elegans. Nature 472: 313–318 doi:10.1038/nature09821 - DOI - PMC - PubMed

Publication types