. 2014 Feb 27;10(2):e1004177.
doi: 10.1371/journal.pgen.1004177. eCollection 2014 Feb.

miR-100 induces epithelial-mesenchymal transition but suppresses tumorigenesis, migration and invasion

Affiliations

miR-100 induces epithelial-mesenchymal transition but suppresses tumorigenesis, migration and invasion

Dahu Chen et al. PLoS Genet. .

Abstract

Whether epithelial-mesenchymal transition (EMT) is always linked to increased tumorigenicity is controversial. Through microRNA (miRNA) expression profiling of mammary epithelial cells overexpressing Twist, Snail or ZEB1, we identified miR-100 as a novel EMT inducer. Surprisingly, miR-100 inhibits the tumorigenicity, motility and invasiveness of mammary tumor cells, and is commonly downregulated in human breast cancer due to hypermethylation of its host gene MIR100HG. The EMT-inducing and tumor-suppressing effects of miR-100 are mediated by distinct targets. While miR-100 downregulates E-cadherin by targeting SMARCA5, a regulator of CDH1 promoter methylation, this miRNA suppresses tumorigenesis, cell movement and invasion in vitro and in vivo through direct targeting of HOXA1, a gene that is both oncogenic and pro-invasive, leading to repression of multiple HOXA1 downstream targets involved in oncogenesis and invasiveness. These findings provide a proof-of-principle that EMT and tumorigenicity are not always associated and that certain EMT inducers can inhibit tumorigenesis, migration and invasion.


Conflict of interest statement

The authors have declared that no competing interests exist.

Figures

Figure 1
Figure 1. miR-100 induces EMT and correlates with the EMT state in human breast cancer.
(A) Venn diagram representation of the 13 miRNAs that are commonly deregulated in HMLE cells transduced with Twist, Snail or ZEB1, compared with mock-infected HMLE cells. (B) Heat map showing expression levels of the nine miRNAs validated by TaqMan qPCR. (C) Phase contrast images of HMLE cells transduced with miR-100, miR-22, miR-125b or miR-720. (D) Immunoblotting of E-cadherin, vimentin and HSP90 in HMLE cells transduced with miR-100 or miR-22, and in MCF7 cells transduced with miR-100. (E) qPCR of miR-100 in a series of human breast cancer cell lines. Data are mean ± SEM. (F) Correlation of miR-100 with CDH1 (F) and VIM (G) expression levels in clinical breast cancer, based on the RNA-Seq data from TCGA. Statistical significance was determined by Spearman rank correlation test. Rs = Spearman rank correlation coefficient.
Figure 2
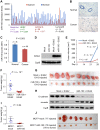
Figure 2. miR-100 inhibits tumorigenesis and is downregulated in human breast cancer.
(A) miR-100 expression levels in four subtypes of human breast tumors and paired normal breast tissues, based on the RNA-Seq data from TCGA. Statistical significance was determined by paired t test. (B) Representative images of in situ hybridization of miR-100 in normal human mammary glands and human breast carcinomas. Blue color indicates positive staining. (C) miR-100 scores (normalized to U6) based on in situ hybridization of human breast tissue microarray (TMA). (D) Immunoblotting of Erbb2 and cyclophilin B (CypB) in HMLE cells transduced with miR-100 and Erbb2, alone or in combination. (E) Tumor growth by 1.5×10⁶ subcutaneously injected HMLE cells transduced with Erbb2 alone or in combination with miR-100. Data are mean ± SEM (n = 10 mice per group). (F, G) Tumor weight (F) and tumor images (G) of mice with subcutaneous injection of HMLE cells transduced with Erbb2 alone or in combination with miR-100, at day 31 after implantation. Data in (F) are mean ± SEM (n = 10 mice per group). (H) Immunoblotting of E-cadherin, vimentin and cyclophilin B (CypB) in tumor lysates from (G). (I, J) Tumor weight (I) and tumor images (J) of mice with subcutaneous injection of 5×10⁶ miR-100-transduced MCF7 cells, at day 22 after implantation. Data in (I) are mean ± SEM (n = 7–8 mice per group). Statistical significance in (C), (E), (F) and (I) was determined by two-tailed, unpaired Student's t test.
Figure 3
Figure 3. miR-100 downregulates E-cadherin by targeting SMARCA5.
(A) Immunoblotting of SMARCA5, HOXA1 and HSP90 in HMLE and MCF7 cells transduced with miR-100. (B) Luciferase activity of the wild-type or mutant HOXA1 3′ UTR reporter gene in 293T cells with ectopic expression of miR-100. (C) Immunoblotting of SMARCA5, E-cadherin and cyclophilin B (CypB) in HMLE cells infected with the SMARCA5 shRNA (shSMARCA5) or the pLKO.1-puro lentiviral vector with a scrambled sequence (Scr) that does not target any mRNA. (D) qPCR of CDH1 in HMLE cells transduced with the control vector (mock), miR-100 alone or in combination with SMARCA5. (E) Immunoblotting of SMARCA5, E-cadherin and HSP90 in HMLE cells transduced with the control vector (mock), miR-100 alone or in combination with SMARCA5. (F) Bisulfite sequencing assay (left panel) and the percentage of CpG methylation (right panel) of the CDH1 promoter in HMLE cells transduced with the control vector (mock), miR-100 alone or in combination with SMARCA5. Open circles: unmethylated CpG sites; solid black circles: methylated CpG sites. Data in (B), (D) and (F) are mean ± SEM, and statistical significance was determined by two-tailed, unpaired Student's t test.
Figure 4
Figure 4. miR-100 suppresses tumorigenesis by targeting HOXA1.
(A) Immunoblotting of HOXA1 and HSP90 in Erbb2-expressing HMLE cells (HMLE-Erbb2) transduced with the control vector (mock), miR-100 alone or in combination with HOXA1. (B–D) Tumor volume (B), tumor weight (C) and tumor images (D) of mice with subcutaneous injection of 3×10⁶ HMLE-Erbb2 cells transduced with the control vector (mock), miR-100 alone or in combination with HOXA1, at day 21 after implantation. Data in (B) and (C) are mean ± SEM (n = 8–9 mice per group). (E) Ki-67 immunohistochemical staining (left panel) and the percentage of Ki-67-positive cells (right panel) in the tumors formed by HMLE-Erbb2 cells transduced with the control vector (mock), miR-100 alone or in combination with HOXA1, at day 21 after implantation. Scale bar: 50 µm. Data are mean ± SEM (n = 3 mice per group). Statistical significance in (B), (C) and (E) was determined by two-tailed, unpaired Student's t test.
Figure 5
Figure 5. miR-100 inhibits migration and invasion by targeting HOXA1.
(A) Transwell migration and Matrigel invasion assays of HMLE-Erbb2 cells transduced with the control vector (mock), miR-100 alone or in combination with HOXA1. (B) Transwell migration and Matrigel invasion assays of miR-100-transduced MCF7 cells. (C) Quantification of the speed of movement (µm/min, n = 10 cells per group) of HMLE-Erbb2 cells transduced with the control vector (mock), miR-100 alone or in combination with HOXA1. (D) qPCR of miR-100 in MDA-MB-231 cells expressing a short hairpin inhibiting miR-100 (Zip-100) or a scrambled hairpin control (Zip-scr). (E) Transwell migration and Matrigel invasion assays of MDA-MB-231 cells expressing a short hairpin inhibiting miR-100 (Zip-100) or a scrambled hairpin control (Zip-scr). Data in (A)–(E) are mean ± SEM, and statistical significance was determined by two-tailed, unpaired Student's t test. (F) H & E staining of the tumors formed by HMLE-Erbb2 cells transduced with the control vector (mock), miR-100 alone or in combination with HOXA1, at day 21 after implantation. Scale bar: 100 µm in upper panels and 50 µm in lower panels.
Figure 6
Figure 6. miR-100 downregulates multiple HOXA1 downstream targets involved in tumorigenesis, migration and invasion.
(A) qPCR of MET, SMO, SEMA3C and CCND1 in HMLE cells transduced with miR-100. (B) qPCR of MET, SMO, SEMA3C and CCND1 in HMLE-Erbb2 cells transduced with the control vector (mock), miR-100 alone or in combination with HOXA1. Data in (A) and (B) are mean ± SEM. (C) Immunoblotting of cyclin D1 and HSP90 in HMLE cells transduced with miR-100, and in HMLE-Erbb2 cells transduced with the control vector (mock), miR-100 alone or in combination with HOXA1.
Figure 7
Figure 7. Regulation of miR-100 expression by ZEB1 and the methylation of the host gene MIR100HG.
(A, B) ChIP-PCR (A) and ChIP-qPCR (B) analysis of ZEB1 binding to the mir-100 gene in 293T cells transfected with SFB-tagged GFP or ZEB1. PCR was performed with primers specific to the Z-box and E-box elements, respectively. qPCR was performed with primers specific to the E-box element. SFB: S-protein, FLAG tag and streptavidin-binding peptide. (C) Activity of a luciferase reporter fused to the putative human mir-100 promoter in 293T cells transfected with the control vector (mock) or ZEB1. Data in (B) and (C) are mean ± SEM, and statistical significance was determined by two-tailed, unpaired Student's t test. (D) MIR100HG gene methylation levels in human breast tumors and paired normal breast tissues, based on the gene methylation data from TCGA. Statistical significance was determined by Wilcoxon signed-rank test. (E) Scattered plot showing the inverse correlation between methylation of the MIR100HG gene and miR-100 expression levels in human breast tumors, based on the RNA-Seq data and gene methylation data from TCGA. Statistical significance was determined by Spearman rank correlation test. Rs = Spearman rank correlation coefficient. (F, G) qPCR of miR-100 in MCF7 (F) and SUM149 (G) cells treated with the DNA demethylating agent 5-azacytidine (AZA) or vehicle control (DMSO). Data are mean ± SEM, and statistical significance was determined by two-tailed, unpaired Student's t test. (H) Model of miR-100-mediated regulation of EMT, tumorigenesis and invasion. Green indicates oncogenic and/or pro-invasive factors; pink indicates tumor-suppressing factors; gray indicates EMT regulators.

Similar articles

Cited by

References

    1. Thiery JP (2002) Epithelial-mesenchymal transitions in tumour progression. Nat Rev Cancer 2: 442–454. - PubMed
    1. Yang J, Weinberg RA (2008) Epithelial-mesenchymal transition: at the crossroads of development and tumor metastasis. Dev Cell 14: 818–829. - PubMed
    1. Scheel C, Onder T, Karnoub A, Weinberg RA (2007) Adaptation versus selection: the origins of metastatic behavior. Cancer Res 67: 11476–11479 discussion 11479–11480. - PubMed
    1. Gregory PA, Bert AG, Paterson EL, Barry SC, Tsykin A, et al. (2008) The miR-200 family and miR-205 regulate epithelial to mesenchymal transition by targeting ZEB1 and SIP1. Nat Cell Biol 10: 593–601. - PubMed
    1. Park SM, Gaur AB, Lengyel E, Peter ME (2008) The miR-200 family determines the epithelial phenotype of cancer cells by targeting the E-cadherin repressors ZEB1 and ZEB2. Genes Dev 22: 894–907. - PMC - PubMed

Publication types

MeSH terms