. 2014 Feb 27;10(2):e1004194.
doi: 10.1371/journal.pgen.1004194. eCollection 2014 Feb.

Selective disruption of aurora C kinase reveals distinct functions from aurora B kinase during meiosis in mouse oocytes

Affiliations

Selective disruption of aurora C kinase reveals distinct functions from aurora B kinase during meiosis in mouse oocytes

Ahmed Z Balboula et al. PLoS Genet. .

Abstract

Aurora B kinase (AURKB) is the catalytic subunit of the chromosomal passenger complex (CPC), an essential regulator of chromosome segregation. In mitosis, the CPC is required to regulate kinetochore microtubule (K-MT) attachments, the spindle assembly checkpoint, and cytokinesis. Germ cells express an AURKB homolog, AURKC, which can also function in the CPC. Separation of AURKB and AURKC function during meiosis in oocytes by conventional approaches has not been successful. Therefore, the meiotic function of AURKC is still not fully understood. Here, we describe an ATP-binding-pocket-AURKC mutant, that when expressed in mouse oocytes specifically perturbs AURKC-CPC and not AURKB-CPC function. Using this mutant we show for the first time that AURKC has functions that do not overlap with AURKB. These functions include regulating localized CPC activity and regulating chromosome alignment and K-MT attachments at metaphase of meiosis I (Met I). We find that AURKC-CPC is not the sole CPC complex that regulates the spindle assembly checkpoint in meiosis, and as a result most AURKC-perturbed oocytes arrest at Met I. A small subset of oocytes do proceed through cytokinesis normally, suggesting that AURKC-CPC is not the sole CPC complex during telophase I. But, the resulting eggs are aneuploid, indicating that AURKC is a critical regulator of meiotic chromosome segregation in female gametes. Taken together, these data suggest that mammalian oocytes contain AURKC to efficiently execute meiosis I and ensure high-quality eggs necessary for sexual reproduction.


Conflict of interest statement

The authors have declared that no competing interests exist.

Figures
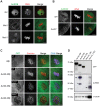
Figure 1
Figure 1. AURKB is expressed in mouse oocytes.
(A) GV-intact oocytes were collected from CF1 mice and matured in vitro for 8 h (Met I), or 16 h (Met II), prior to fixation and staining with an anti-AURKB antibody. (B) GV-intact oocytes were collected from WT and Aurkc−/− mice and matured in vitro for 16 h (Met II), prior to fixation and staining with an anti-AURKB antibody. Merged images show AURKB in green and DNA in red. (C) GV-intact oocytes were collected from WT, Aurkb −/−, and Aurkc−/− mice, microinjected with the indicated cRNA, and matured in vitro for 16 h (Met II), prior to fixation and staining with an anti-Survivin antibody. Merged images show AURKB-GFP in green, Survivin in red, and DNA in blue. These experiments were conducted with a minimum of 20 oocytes for each group. Shown are representative images (Scale bar, 10 µm). (D) 20 GV-intact oocytes were collected from CF1 mice and microinjected with the indicated cRNA. Two hours after injection, the oocytes were matured to Met II in vitro (16 h). The total numbers of non-injected control oocytes (Non-inj.) are indicated in parenthesis. Total cellular lysates were probed with the indicated antibody. The panels are images of the same membrane that was stripped and re-probed. The arrows indicate the specific AURKB protein band, and the asterisk indicates a presumed degradation product of AURKB-GFP.
Figure 2
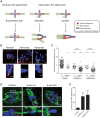
Figure 2. Dominant-negative AURKC (AURKC-DN) disrupts both AURKB/C function in oocytes.
(A) Schematic representation of AURKC-DN. The mutated threonines (T) in the activation loop are underlined. (B–D) Full-grown WT (Aurkc WT) and Aurkc−/− (Aurkc KO) oocytes were injected with PBS or Gfp (Control) or Aurkc-DN cRNA. The injected oocytes were matured for 16 h, followed by fixation and immunostaining with a phospho-specific INCENP (pINCENP) antibody (red in merge). DNA was detected via DAPI staining (blue). Shown are representative confocal Z-projections (scale bar, 10 µm). (C) Corresponding quantification of pINCENP pixel intensities in B. This experiment was conducted 3 times with a minimum of 20 oocytes in each group. (D) Percentage of oocytes that extruded polar bodies (PBE). One-way ANOVA was used to analyze the data. *** P<0.001, **** P<0.0001.
Figure 3
Figure 3. AURKC-LA and AURKC-DN are catalytically inactive.
(A) Schematic representation of AURKC-LA. The mutated leucine (L) residue in the ATP binding pocket is underlined. (B–G) Full-grown WT oocytes were injected with the indicated cRNA; controls were injected with PBS or Gfp cRNA. Met I oocytes were fixed and examined for phosphorylated AURKC (pAURKC) (red in merge) and GFP expression (green in merge) (B), phosphorylated INCENP (pINCENP) (red in merge) (D) and phosphorylated H3S10 (pH3S10) (red in merge) (F). DNA was detected via DAPI staining (blue). Shown are representative Z-projections from confocal microscopy (scale bars, 10 µm). (C, E, and G) Corresponding quantification of fluorescence intensity of B, D, and F, respectively. The experiment was conducted at least 2 times with a minimum of 20 oocytes in each group. Shown are representative images. One-way ANOVA was used to analyze the data. **P<0.01; *** P<0.001; **** P<0.0001.
Figure 4
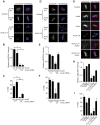
Figure 4. AURKC-L93A (AURKC-LA) is catalytically inactive, and selectively disrupts AURKC function.
(A–I) Full-grown WT or Aurkb −/− (A–C), WT or Aurkc −/− oocytes (D–F) or WT CF1 oocytes (G–I) were injected with the indicated cRNA; controls were injected with either PBS or Gfp cRNA. The microinjected oocytes were matured in vitro to Met II (16 h) followed by pINCENP detection (red in merge) via confocal microscopy. DNA was detected by DAPI staining (blue). Shown are representative Z-projections (scale bar, 10 µm). (B, E, H) Corresponding quantification of pINCENP intensities. (C, F, I) Percentage of oocytes that extruded polar bodies (PBE). The experiments were conducted 3 times with a minimum of 15 oocytes in each group. One-way ANOVA was used to analyze the data. * P<0.05, ** P<0.01, *** P<0.001.
Figure 5
Figure 5. AURKC is required to retain CPC localization at Met I.
Full-grown oocytes were injected with the indicated cRNA; controls were injected with PBS or Gfp cRNA. After 8 h of in vitro maturation, Met I oocytes were fixed and examined for localization of the GFP-tagged mutant protein (green in merge) (A), endogenous AURKC (red in merge) (B), endogenous Survivin (red in merge) (C), and endogenous AURKB (red in merge) (E). DNA was detected via DAPI staining (blue). Shown are representative confocal Z-projections (scale bars, 10 µm). (D) Corresponding quantification of oocytes with properly localized Survivin in B. The experiments were conducted at least 2 times with a minimum of 20 oocytes in each group. One-way ANOVA was used to analyze the data. *P<0.05.
Figure 6
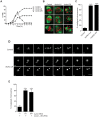
Figure 6. Meiotic progression to Met II and chromosome alignment at Met I requires AURKC.
(A) Full-grown WT oocytes from CF1 mice were injected with the indicated cRNA, followed by in vitro maturation (16 h) and analysis of the timing of polar body extrusion (PBE) by live cell imaging. The experiment was carried out 2 times with a minimum of 30 oocytes in each group. (B) Representative confocal Z-projections of DNA (red) and spindle configurations (green) from oocytes at Met I (7 h after milrinone washout) that were injected with the indicated cRNA. The experiment was conducted 3 times with a minimum of 30 oocytes in each group (Scale bar, 10 µm). (C) Quantification of the number of oocytes with misaligned chromosomes analyzed in B. (D) Representative H2B-mCherry fluorescence images of oocytes coinjected with the indicated cRNA and H2B-mCherry cRNA; the white arrows indicate non-aligned bivalent chromosomes (Scale bar, 50 µm) (E) Met I exit was blocked by microinjection of non-degradable cyclin B (150 ng/µl) mixed with the indicated cRNA, and examined for chromosome alignment by immunocytochemistry. Controls were injected with either PBS or Gfp cRNA. The experiment was conducted 2 times with a minimum of 20 oocytes in each group. One-way ANOVA was used to analyze the data. **** P<0.0001.
Figure 7
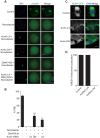
Figure 7. AURKC does not maintain SAC activation by itself.
(A) Full-grown oocytes were injected with the indicated cRNA; controls were injected with PBS or Gfp cRNA. Nocodazole and ZM447439 were added to the maturation medium as indicated to a final concentration of 5 µM and 2 µM, respectively. After maturation for 16 h, the oocytes were examined for extrusion of the first polar body (PBE) and spindle formation (green) via fluorescence microscopy (scale bar, 50 µm). DNA was detected via DAPI staining (blue). The experiment was conducted 3 times with a minimum of 30 oocytes in each group. Shown are representative images; the white asterisks mark PBs. (B) Quantification of the percentage of oocytes that extrude a polar body (PBE) in A. One-way ANOVA was used to analyze the data. ** P<0.01; *** P<0.001. (C) Bub1-Gfp cRNA (300 ng/µl) was co-injected with the indicated cRNA and in vitro matured oocytes were then examined by confocal microscopy to detect GFP (green in merge). DNA was detected via DAPI staining (blue). Shown are representative Z-projections (scale bar, 10 µm). The experiment was conducted 2 times with a minimum of 20 oocytes in each group. (D) Quantification of the percentage of oocytes in C that contained BUB1-GFP at kinetochores.
Figure 8
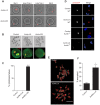
Figure 8. AURKC alone does not regulate cytokinesis and loss of its function leads to aneuploid eggs.
(A) Snapshots from a time-lapse series showing chromatin (H2B-mCherry; red) and bright field images from oocytes co-injected with H2B-mCherry and the indicated GFP-tagged cRNA (Scale bar, 50 µm). (B) Representative Z-projections obtained by confocal microscopy of spindle (green) and DNA (red) configurations of Met II eggs (scale bar, 50 µm). (C) Percentage of oocytes that failed cytokinesis. The experiment was conducted 3 times and at least 20 oocytes were examined in each group. (D) WT and Aurkb−/− oocytes were microinjected with Aurkc-LA cRNA followed by maturation to telophase I and examination of phosphorylated INCENP (pINCENP) (red in merge) (scale bar, 10 µm). DNA was detected by DAPI (blue). Shown are representative examples. (E) Met II eggs from the indicated groups were treated with monastrol followed by detection of DNA (red) and kinetochores with Crest anti-sera (green) (scale bar, 10 µm). The number of kinetochores was counted in each egg, and an aberration of 40 was scored as aneuploid. The experiment was conducted 3 times with a minimum of 20 oocytes in each experiment. Shown are representative Z-projections. (F) Quantification of D. One-way ANOVA was used to analyze the data in B and Student's t-test was used to analyze the data in E. Controls were injected with either PBS or Gfp cRNA. Values with asterisks vary significantly, *P<0.05; **** P<0.0001.
Figure 9
Figure 9. AURKC is the primary CPC kinase that corrects erroneous K-MT attachments.
(A) Schematic representation of normal and abnormal K-MT attachments. Sister chromatids are indicated in the same color. Note that chiasmata linking the homologous chromosomes were omitted for simplicity purposes. (B–E) GV oocytes were microinjected with the indicated cRNA and matured to Met I. Kinetochores were labeled with CREST (red) and inter-kinetochore distance was measured using Image J (dotted line). DNA was counterstained with DAPI (blue). The scale bar represents 10 µm for the original images and 2 µm for the magnified images. (C) Quantification of the inter-kinetochore distance from aligned (A.) and misaligned (Non-A.) chromosomes. Each data point is the distance between two sister kinetochore pairs within a bivalent chromosome in an oocyte. The experiment was conducted 3 times with a minimum of 20 oocytes in each group. (D) Representative images of K-MT attachments. Oocytes were incubated in ice-cold medium to depolymerize non-kinetochore attached tubulin prior to fixation and detection of kinetochores (red), tubulin (green) and DNA (blue) (Scale bar, 10 µm). The experiment was conducted 3 times with a minimum of 15 oocytes in each group. (E) Quantification of abnormal K-MT attachments. One-way ANOVA was used to analyze the data. ** P<0.01, *** P<0.001, **** P<0.0001.

Similar articles

Cited by

References

    1. Hassold T, Chiu D (1985) Maternal age-specific rates of numerical chromosome abnormalities with special reference to trisomy. Hum Genet 70: 11–17. - PubMed
    1. Hassold T, Hall H, Hunt P (2007) The origin of human aneuploidy: where we have been, where we are going. Hum Mol Genet 16 Spec No. 2: R203–208. - PubMed
    1. Hassold T, Hunt P (2001) To err (meiotically) is human: the genesis of human aneuploidy. Nat Rev Genet 2: 280–291. - PubMed
    1. Leland S, Nagarajan P, Polyzos A, Thomas S, Samaan G, et al. (2009) Heterozygosity for a Bub1 mutation causes female-specific germ cell aneuploidy in mice. Proc Natl Acad Sci U S A 106: 12776–12781. - PMC - PubMed
    1. Jones KT (2008) Meiosis in oocytes: predisposition to aneuploidy and its increased incidence with age. Hum Reprod Update 14: 143–158. - PubMed

Publication types