

Pleiotropic effect of common variants at ABO Glycosyltranferase locus in 9q32 on plasma levels of pancreatic lipase and angiotensin converting enzyme
- PMID: 24586218
- PMCID: PMC3938410
- DOI: 10.1371/journal.pone.0055903
Pleiotropic effect of common variants at ABO Glycosyltranferase locus in 9q32 on plasma levels of pancreatic lipase and angiotensin converting enzyme
Abstract
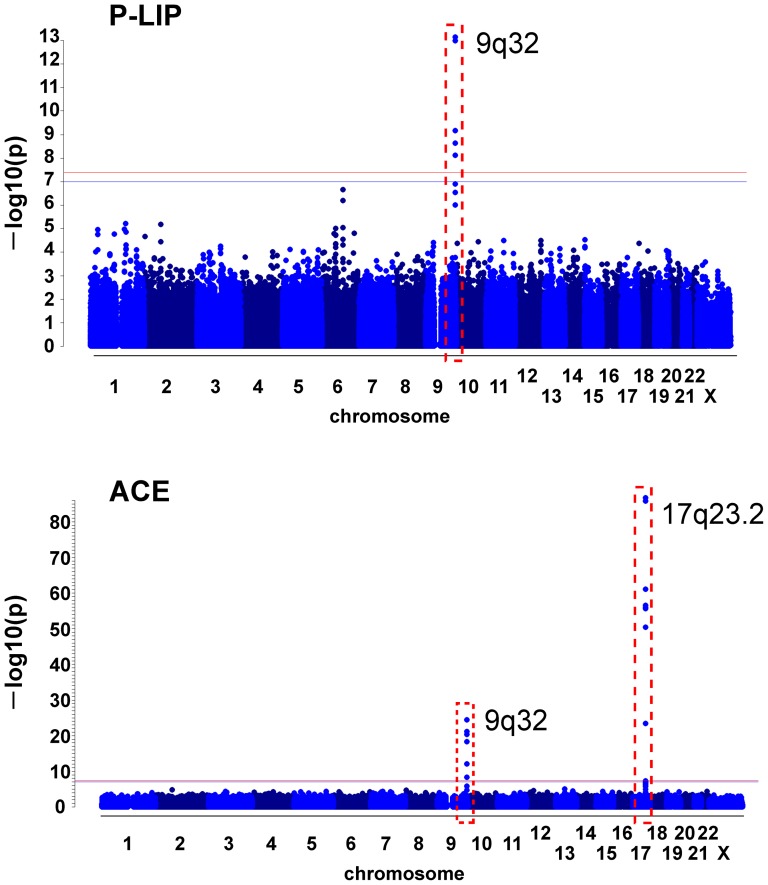
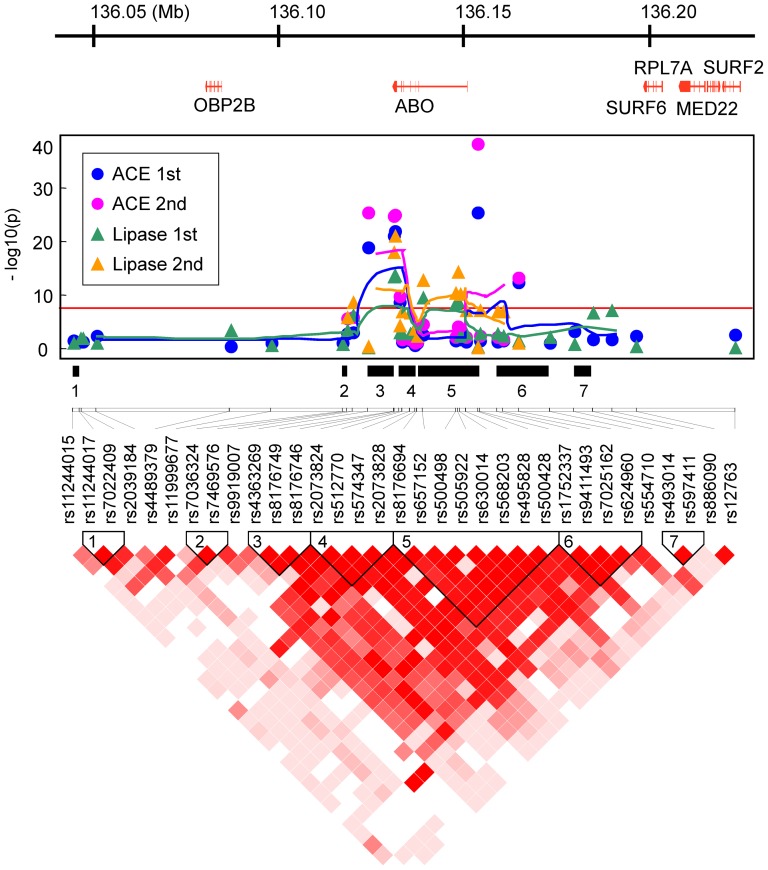
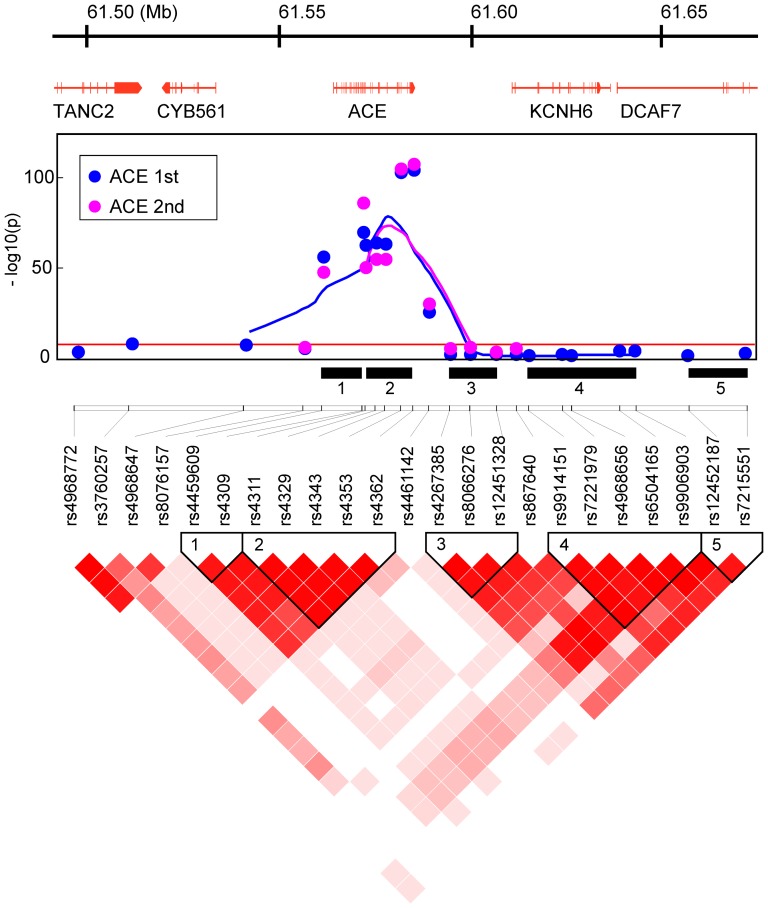
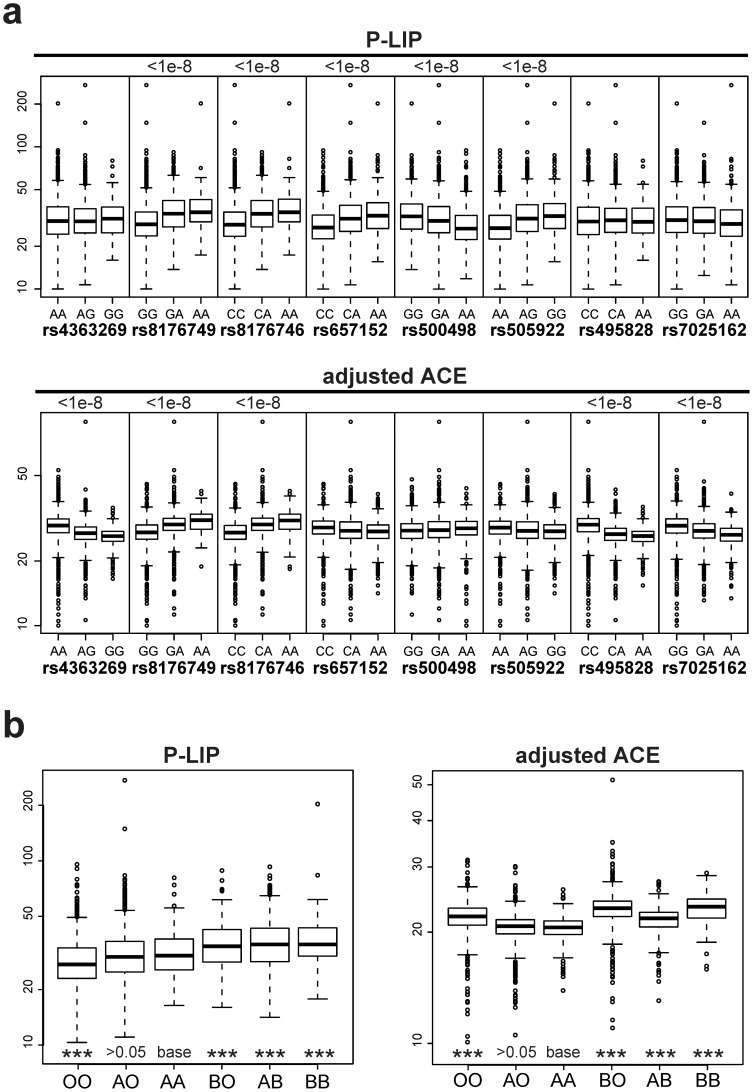
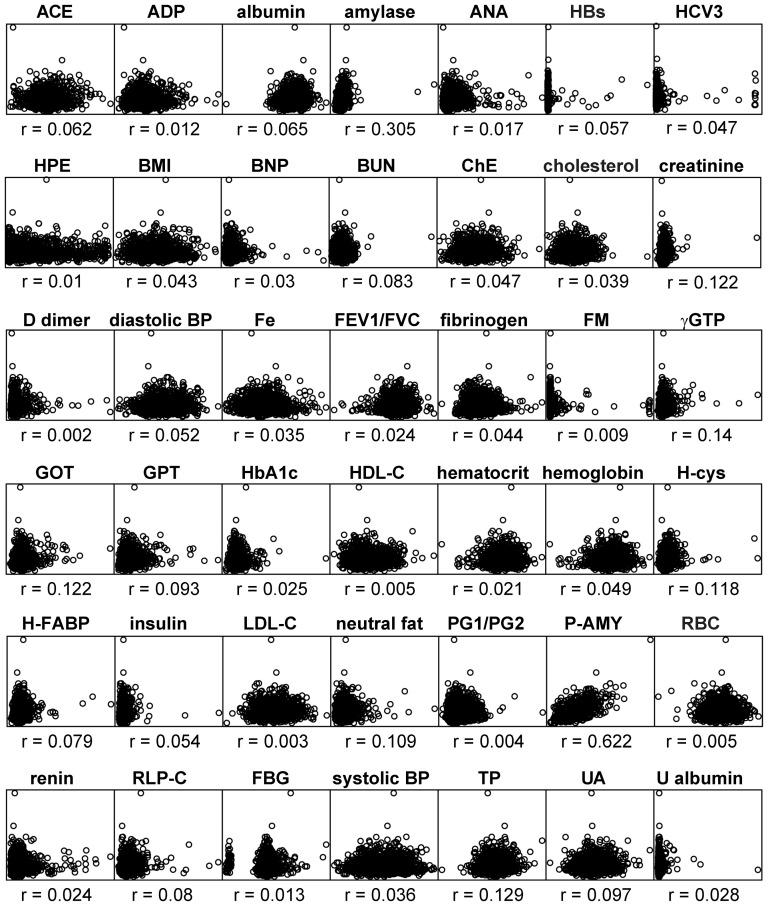
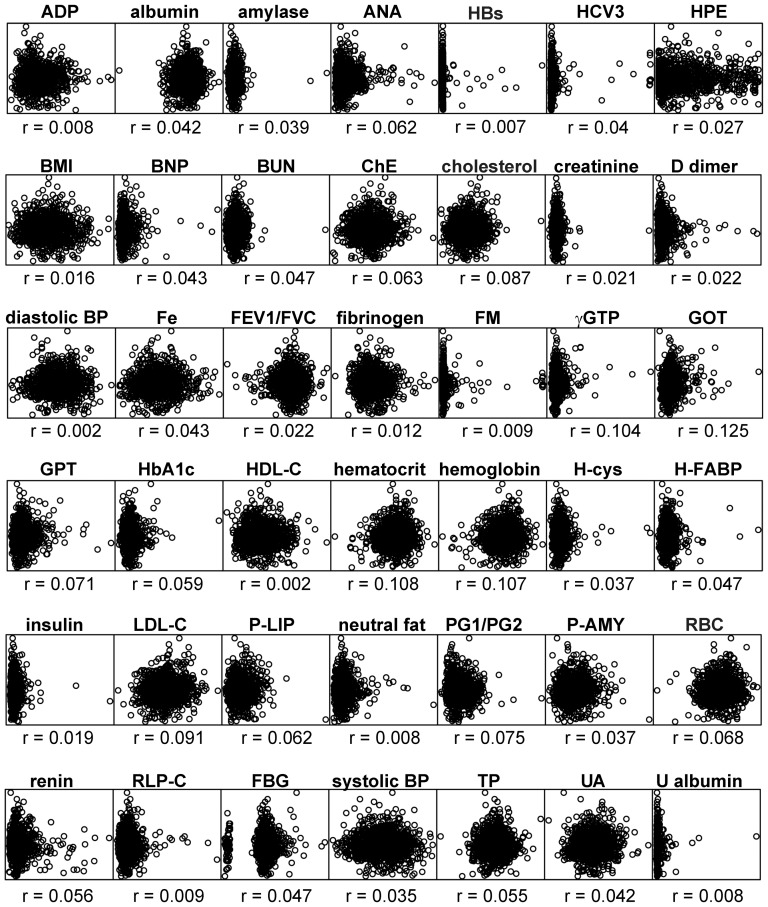
For forty-three clinical test values presumably associated to common complex human diseases, we carried out a genome-wide association study using 600K SNPs in a general Japanese population of 1,639 individuals (1,252 after quality control procedures) drawn from a regional cohort, followed by a replication study for statistically significant SNPs (p = 1.95 × 10(-9)-8.34 × 10(-39)) using an independent population of 1,671 from another cohort. In this single two-stage study, we newly found strong and robust associations of common variants at the ABO histo-blood glycosyltransferase locus in 9q32 with the plasma levels of pancreatic lipase (P-LIP), in addition to successful confirmation of the known ABO association of angiotensin converting enzyme (ACE) independent of the ACE1 gene in 17q23.2 with the ACE level. Our results are compatible with the previously reported association between the ABO gene and pancreatic cancer, and show that the effect of these common variants at the ABO locus on the P-LIP and ACE levels is largely opposing and pleiotropic.
Conflict of interest statement
Figures
Similar articles
-
Quantitative variation in plasma angiotensin-I converting enzyme activity shows allelic heterogeneity in the ABO blood group locus.Ann Hum Genet. 2013 Nov;77(6):465-71. doi: 10.1111/ahg.12034. Epub 2013 Aug 13. Ann Hum Genet. 2013. PMID: 23937567
-
Influence of ABO genotype and phenotype on angiotensin-converting enzyme plasma activity.J Renin Angiotensin Aldosterone Syst. 2014 Dec;15(4):580-4. doi: 10.1177/1470320313510583. Epub 2014 May 6. J Renin Angiotensin Aldosterone Syst. 2014. PMID: 24803075
-
Blood type gene locus has no influence on ACE association with Alzheimer's disease.Neurobiol Aging. 2015 Apr;36(4):1767.e1-1767.e2. doi: 10.1016/j.neurobiolaging.2015.01.013. Epub 2015 Jan 22. Neurobiol Aging. 2015. PMID: 25681990
-
From an ACE polymorphism to genome-wide searches for eQTL.J Clin Invest. 2013 Jan;123(1):111-2. doi: 10.1172/JCI66618. Epub 2013 Jan 2. J Clin Invest. 2013. PMID: 23281417 Free PMC article. Review.
-
Review: association between angiotensin converting enzyme G2350A polymorphism and hypertension risk: a meta-analysis.J Renin Angiotensin Aldosterone Syst. 2011 Mar;12(1):8-14. doi: 10.1177/1470320310375859. Epub 2010 Jul 16. J Renin Angiotensin Aldosterone Syst. 2011. PMID: 20639399 Review.
Cited by
-
Smooth-Threshold Multivariate Genetic Prediction with Unbiased Model Selection.Genet Epidemiol. 2016 Apr;40(3):233-43. doi: 10.1002/gepi.21958. Epub 2016 Mar 6. Genet Epidemiol. 2016. PMID: 26947266 Free PMC article.
-
Human genetic basis of coronavirus disease 2019.Signal Transduct Target Ther. 2021 Sep 20;6(1):344. doi: 10.1038/s41392-021-00736-8. Signal Transduct Target Ther. 2021. PMID: 34545062 Free PMC article. Review.
-
Effect of ACE1 polymorphism rs1799752 on protein levels of ACE2, the SARS-CoV-2 entry receptor, in alveolar lung epithelium.ERJ Open Res. 2021 Apr 19;7(2):00940-2020. doi: 10.1183/23120541.00940-2020. eCollection 2021 Apr. ERJ Open Res. 2021. PMID: 33889638 Free PMC article.
-
The association between ABO blood group and SARS-CoV-2 infection: A meta-analysis.PLoS One. 2020 Sep 18;15(9):e0239508. doi: 10.1371/journal.pone.0239508. eCollection 2020. PLoS One. 2020. PMID: 32946531 Free PMC article.
-
COVID-19 and Individual Genetic Susceptibility/Receptivity: Role of ACE1/ACE2 Genes, Immunity, Inflammation and Coagulation. Might the Double X-chromosome in Females Be Protective against SARS-CoV-2 Compared to the Single X-Chromosome in Males?Int J Mol Sci. 2020 May 14;21(10):3474. doi: 10.3390/ijms21103474. Int J Mol Sci. 2020. PMID: 32423094 Free PMC article.
References
-
- Wray NR, Visscher PM (2007) Mapping common disease genes. In: Genes and Common Disease. eds. Wright AF, Hastie N. (Cambridge: Cambridge University Press).
-
- Kamatani Y, Matsuda K, Okada Y, Kubo M, Hosono N, et al. (2010) Genome-wide association study of hematological and biochemical traits in a Japanese population. Nat Genet 42: 210–215. - PubMed
-
- Falconer DS, Mackay TFC (1996). Introduction to Quantitative Genetics, 4th edn. (Edinburgh: Longman).
Publication types
MeSH terms
Substances
LinkOut - more resources
Full Text Sources
Other Literature Sources
Miscellaneous
