. 2014 Feb 20;9(2):e88274.
doi: 10.1371/journal.pone.0088274. eCollection 2014.

Quantitative trait loci affecting atherosclerosis at the aortic root identified in an intercross between DBA2J and 129S6 apolipoprotein E-null mice

Affiliations

Quantitative trait loci affecting atherosclerosis at the aortic root identified in an intercross between DBA2J and 129S6 apolipoprotein E-null mice

Yukako Kayashima et al. PLoS One. .

Abstract

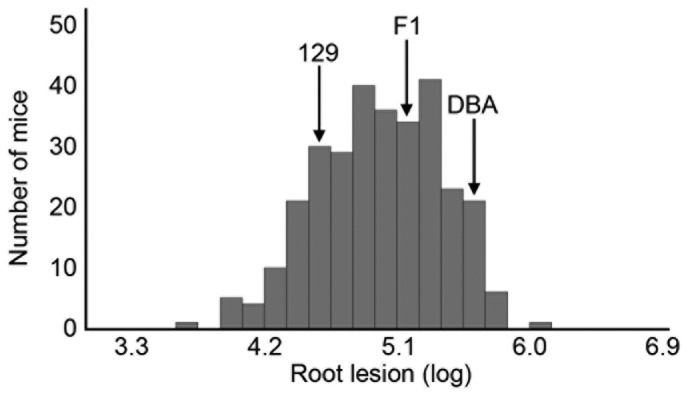
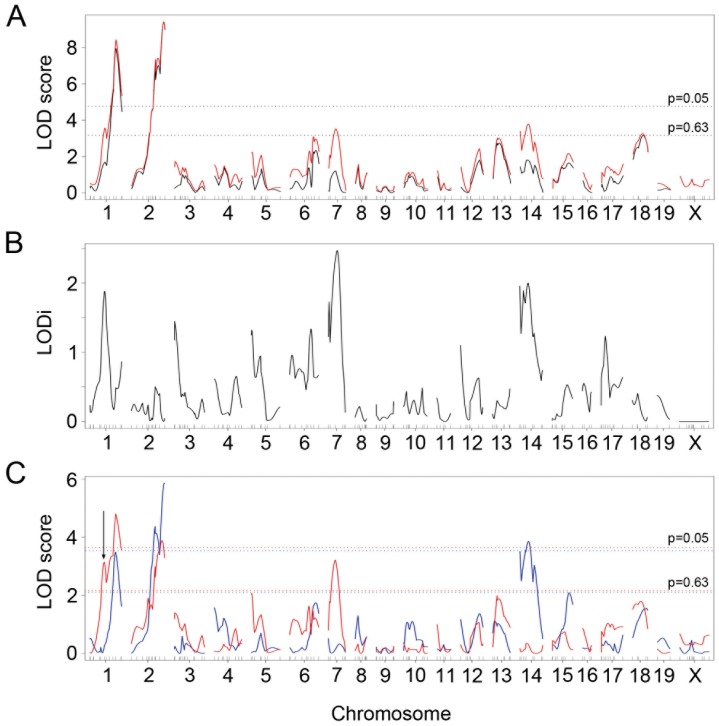
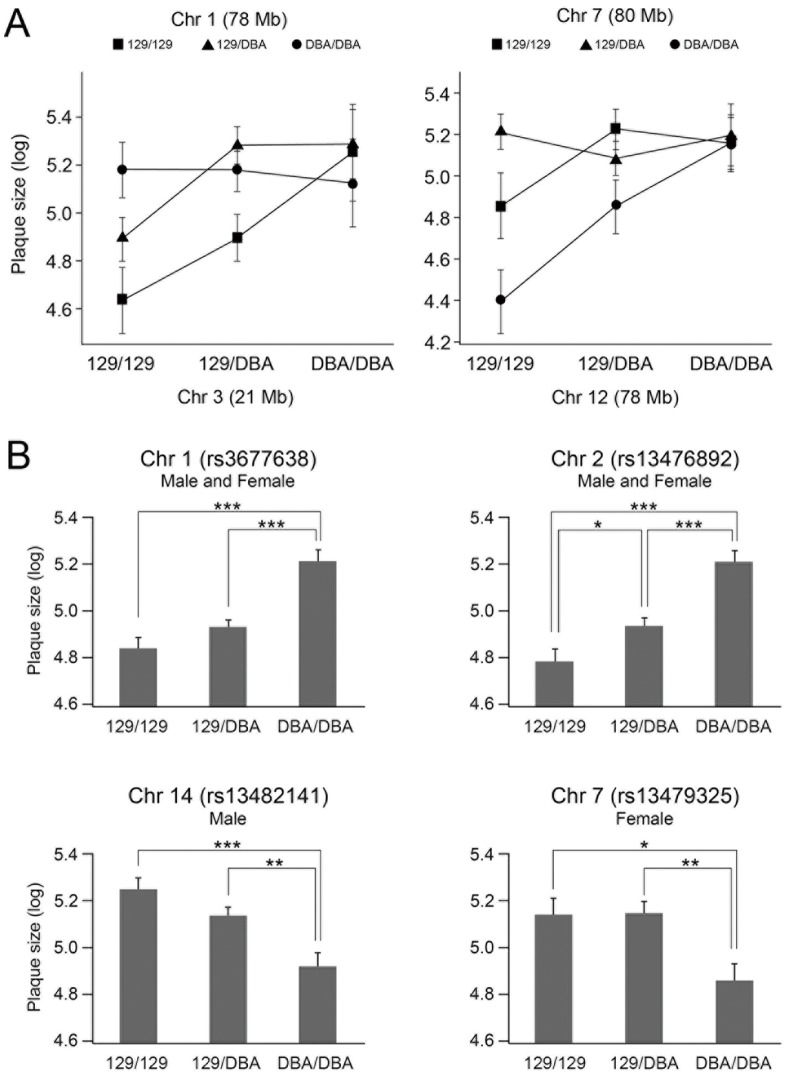
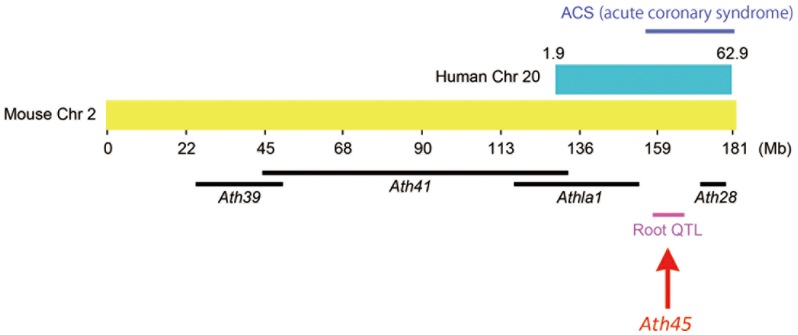
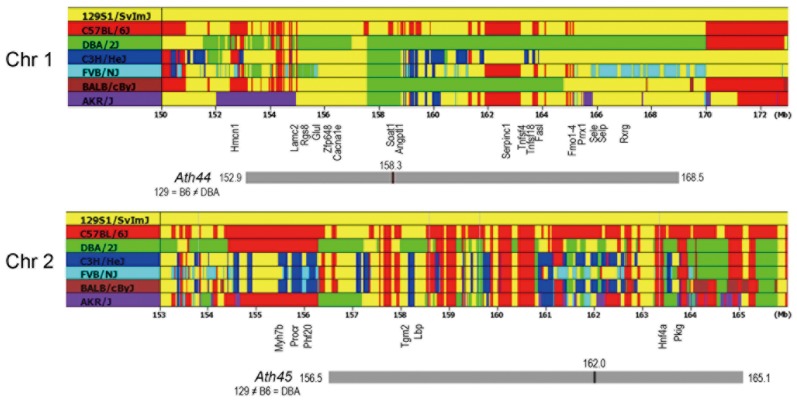
Apolipoprotein E-null mice on a DBA/2J genetic background (DBA-apoE) are highly susceptible to atherosclerosis in the aortic root area compared with those on a 129S6 background (129-apoE). To explore atherosclerosis-responsible genetic regions, we performed a quantitative trait locus (QTL) analysis using 172 male and 137 female F2 derived from an intercross between DBA-apoE and 129-apoE mice. A genome-wide scan identified two significant QTL for the size of lesions at the root: one is Ath44 on Chromosome (Chr) 1 at 158 Mb, and the other Ath45 on Chr 2 at 162 Mb. Ath44 co-localizes with but appears to be independent of a previously reported QTL, Ath1, while Ath45 is a novel QTL. DBA alleles of both Ath44 and Ath45 confer atherosclerosis-susceptibility. In addition, a QTL on Chr 14 at 73 Mb was found significant only in males, and 129 allele conferring susceptibility. Further analysis detected female-specific interactions between a second QTL on Chr 1 at 73 Mb and a QTL on Chr 3 at 21 Mb, and between Chr 7 at 84 Mb and Chr 12 at 77 Mb. These loci for the root atherosclerosis were independent of QTLs for plasma total cholesterol and QTLs for triglycerides, but a QTL for HDL (Chr 1 at 126 Mb) overlapped with the Ath44. Notably, haplotype analysis among 129S6, DBA/2J and C57BL/6 genomes and their gene expression data narrowed the candidate regions for Ath44 and Ath45 to less than 5 Mb intervals where multiple genome wide associations with cardiovascular phenotypes have also been reported in humans. SNPs in or near Fmo3, Sele and Selp for Ath44, and Lbp and Pkig for Ath45 were suggested for further investigation as potential candidates underlying the atherosclerosis susceptibility.


Conflict of interest statement

Competing Interests: The authors have declared that no competing interests exist.

Figures

Figure 1
Figure 1. Distributions of atherosclerotic plaque sizes at the root area.
Histograms of log-transformed atherosclerotic plaque sizes at the aortic root in 309 F2 mice derived from 129-apoE and DBA-apoE mice. Arrows represent the positions of average root plaque sizes for parental 129-apoE, DBA-apoE and F1 mice.
Figure 2
Figure 2. Genome-wide single QTL scans for atherosclerotic plaque size at the root.
(A) LOD curves for the root lesion with sex as an additive covariate (black line) and as an interactive covariate (red line). X-axis represents positions on chromosome (cM) and y-axis represents the LOD score. The horizontal dashed lines represent the thresholds for significant QTL (p = 0.05) and suggestive QTL (p = 0.63) in the sex-interactive model. (B) Differences in LOD curves of the sex-additive model and the sex-interactive model (LODi). (C) LOD curves for root lesion in males (blue line) and females (red line). The horizontal dashed lines represent the thresholds for significant QTL (p = 0.05) and suggestive QTL (p = 0.63) in males (blue) and females (red). The arrow indicates the second QTL on Chr 1 in females.
Figure 3
Figure 3. Allele effects of QTL for atherosclerosis.
(A) Allelic distribution of the main effect QTL for atherosclerosis at the root in Chr 1 and Chr 2 in both sexes, Chr 14 in males, and Chr 7 in females. Atherosclerotic plaque sizes are indicated as the mean ± SEM. *p<0.05, **p<0.01, ***p<0.001. (B) The effects of interactions detected by the pair-wise genome scan on the plaque size (μm2) expressed in log. Interactions between Chr 1 and Chr 3 in females (left) and interactions between Chr 7 and Chr 12 in females (right).
Figure 4
Figure 4. Comparative genomic map of mouse Chromosome 2.
Mouse Chr 2 and homologous human Chr 20 regions are derived from the Virtual Comparative Map (VCMap) tool. The black bars represent confidence intervals of previously identified QTL for atherosclerosis; the magenta bar represents Ath45; the blue bar represents the human locus linked with acute coronary syndrome (ACS).
Figure 5
Figure 5. Haplotype analysis.
Chromosome maps of Chr 1 and Chr 2 corresponding to Ath44 and Ath45 from the Parlegen Mouse SNP Browser. Sequences of 129 strain are colored by yellow and identical sequences are shown in the same color. Positions of several candidate genes are shown.

Similar articles

Cited by

References

    1. Chen Y, Rollins J, Paigen B, Wang X (2007) Genetic and genomic insights into the molecular basis of atherosclerosis. Cell Metab 6: 164–179. - PMC - PubMed
    1. Prins BP, Lagou V, Asselbergs FW, Snieder H, Fu J (2012) Genetics of coronary artery disease: Genome-wide association studies and beyond. Atherosclerosis 225: 1–10. - PubMed
    1. Smith JD, James D, Dansky HM, Wittkowski KM, Moore KJ, et al. (2003) In silico quantitative trait locus map for atherosclerosis susceptibility in apolipoprotein E-deficient mice. Arterioscler Thromb Vasc Biol 23: 117–122. - PubMed
    1. Maeda N, Johnson L, Kim S, Hagaman J, Friedman M, et al. (2007) Anatomical differences and atherosclerosis in apolipoprotein E-deficient mice with 129/SvEv and C57BL/6 genetic backgrounds. Atherosclerosis 195: 75–82. - PMC - PubMed
    1. Dansky HM, Shu P, Donavan M, Montagno J, Nagle DL, et al. (2002) A phenotype-sensitizing Apoe-deficient genetic background reveals novel atherosclerosis predisposition loci in the mouse. Genetics 160: 1599–1608. - PMC - PubMed

Publication types

Substances