. 2014 Feb 28;9(2):e88579.
doi: 10.1371/journal.pone.0088579. eCollection 2014.

Realistic three dimensional fitness landscapes generated by self organizing maps for the analysis of experimental HIV-1 evolution

Affiliations

Realistic three dimensional fitness landscapes generated by self organizing maps for the analysis of experimental HIV-1 evolution

Ramón Lorenzo-Redondo et al. PLoS One. .

Erratum in

  • PLoS One. 2014;9(5):e98423

Abstract

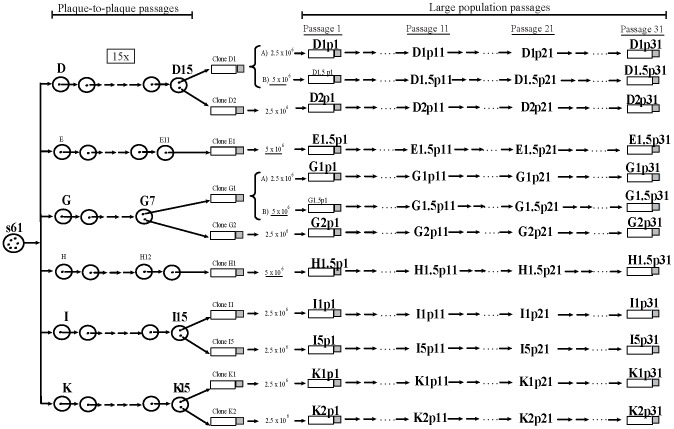
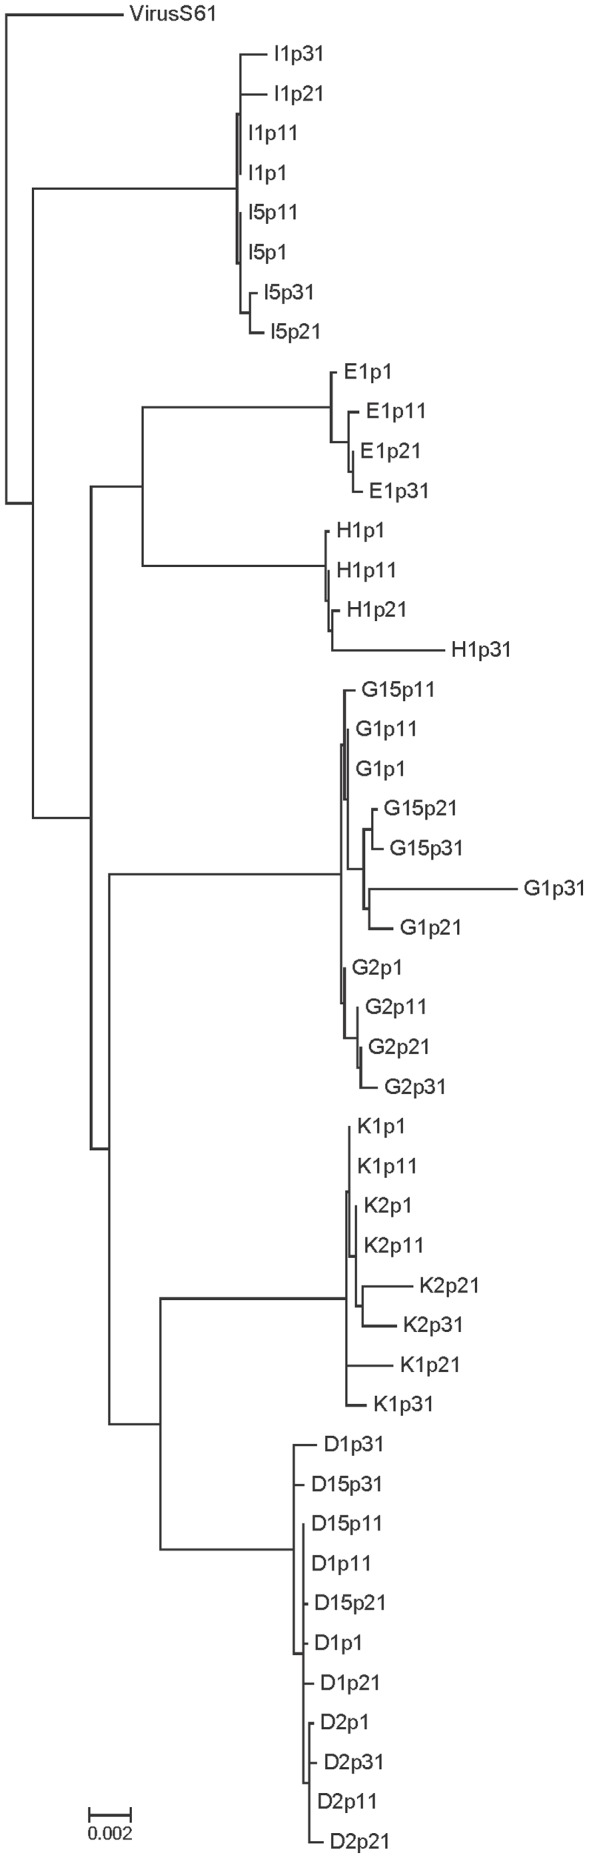
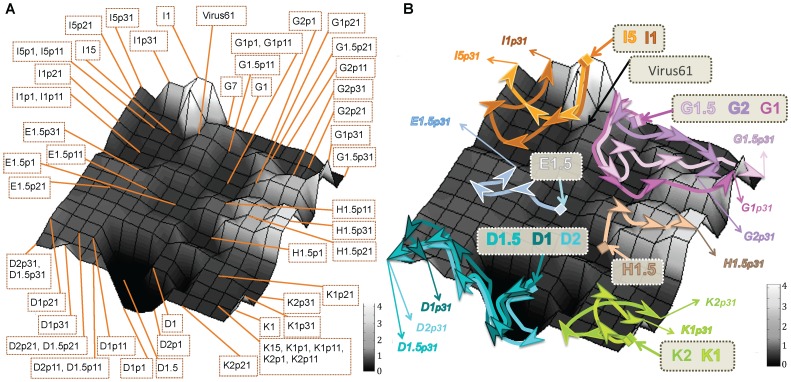
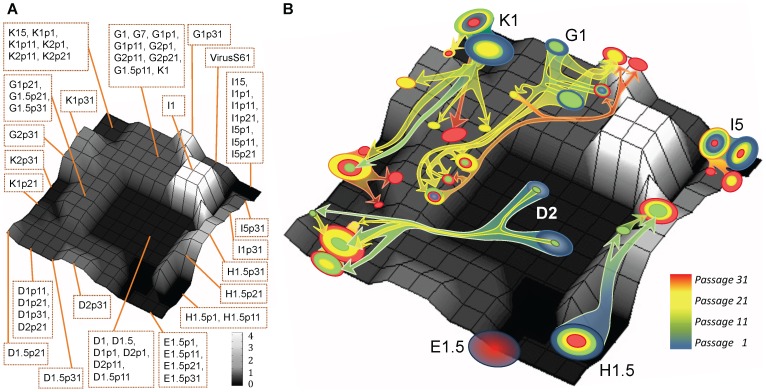
Human Immunodeficiency Virus type 1 (HIV-1) because of high mutation rates, large population sizes, and rapid replication, exhibits complex evolutionary strategies. For the analysis of evolutionary processes, the graphical representation of fitness landscapes provides a significant advantage. The experimental determination of viral fitness remains, in general, difficult and consequently most published fitness landscapes have been artificial, theoretical or estimated. Self-Organizing Maps (SOM) are a class of Artificial Neural Network (ANN) for the generation of topological ordered maps. Here, three-dimensional (3D) data driven fitness landscapes, derived from a collection of sequences from HIV-1 viruses after "in vitro" passages and labelled with the corresponding experimental fitness values, were created by SOM. These maps were used for the visualization and study of the evolutionary process of HIV-1 "in vitro" fitness recovery, by directly relating fitness values with viral sequences. In addition to the representation of the sequence space search carried out by the viruses, these landscapes could also be applied for the analysis of related variants like members of viral quasiespecies. SOM maps permit the visualization of the complex evolutionary pathways in HIV-1 fitness recovery. SOM fitness landscapes have an enormous potential for the study of evolution in related viruses of "in vitro" works or from "in vivo" clinical studies with human, animal or plant viral infections.


Conflict of interest statement

Competing Interests: Co-corresponding author Cecilio Lopez-Galindez is a PLOS ONE Editorial Board member, but this does not alter the authors' adherence to PLOS ONE Editorial policies and criteria.

Figures

Figure 1
Figure 1. Genealogy of the HIV-1 viral clones studied.
Schematic representation of the serial passages performed with the viruses. Six biological clones, derived from a natural isolate , represented by circles in the left part of the Figure, were plaque to plaque passaged for 15 rounds resulting in drastic fitness losses . Some of the clones (G, E and H) did not overcame the 15 passages . In general, two clones from the final debilitated biological clones designated D1, D2, E1, G1, G2, H1, I1, I5, K1 and K2 were later subjected to large population recovery passages . Large population passages (10, 20 and 30) with these clones, represented by bottles, arrows and dots in the right part of the figure, were performed in 2.5×10⁶ and 5×10⁶ MT-4 cells . Viral populations are indicated by letters identifying the clone, followed by p1 for the initial population, p11 for passage 11, p21 for passage 21 and p31 for passage 31 , . Clones D1 and G1 that are represented after keys were passaged in parallel in 2.5×10⁶ (designated A) and in 5×10⁶ MT-4 cells (designated B) . Clones E1, and H1 were passaged only in 5×10⁶ MT-4 cells. The set of 55 viruses used in the present work are marked in bigger and bold font.
Figure 2
Figure 2. Maximum Likelihood phylogenetic tree of the studied viruses.
Maximum Likelihood tree constructed with the complete genomic sequences of the studied viruses and the parental S61 virus. The tree parameters of the weighted evolutionary model were obtained previously by JModelTest and the tree was obtained by the PHYML program. Viruses grouped by lineages with some long branches. Bar represents the genetic distance.
Figure 3
Figure 3. Representation of the fitness landscape of the HIV-1 studied viruses from the complete genome sequences and depiction of the viral recovery pathways.
The landscape was constructed by SOM with the complete genomic sequences from the set of 55 viruses (see Figure 1) and labelled with the fitness value of the closest sequence (factor L = 1 was used to label the network). The SOM was formed by a grid of 15×15 neurons (Fig. S1). Each vertex of the bi-dimensional mesh symbolized a neuron of the SOM network. Grey scale of the landscape represents the fitness values, from the lowest values in black to the highest in white. A) Fitness landscape showing the neuron that maps each viral sequence. B) Fitness landscape map displaying the pathways followed by the different viruses during the recovery passages, where the viruses from the same lineage are linked with the same colour arrow.
Figure 4
Figure 4. Representation of the fitness landscape from viral consensus sequences in the V1–V2 region in env gene and of the evolutionary trajectories of quasispecies variants.
The landscape was created by SOM (15×15 neurons) with the 55 consensus sequences in the V1–V2 region in env gene from the global sequences, labelled as in Figure 3 (with an L = 1 factor) and drawn using the same grey scale as in Figure 3. A) Fitness landscape map showing the neuron that maps each viral consensus sequence. B) Representation of some of the 911 sequences from the viral quasispecies dataset, with unknown fitness values, projected on this fitness landscape map. The quasispecies variants from each virus are displayed as a circle over the neuron that maps them, and the diameter of the circle symbolizes the proportion of variants identified in passage 1 (in blue), passage 11 (in green), passage 21 (yellow) and passage 31 (red). The quantification of the quasispecies variants in each neuron is summarized in Table S4 in File S1. Colour arrows joining the circles show the estimated evolutionary trajectories of the viral clones during the recovery passages.

Similar articles

Cited by

References

    1. Coffin JM (1995) HIV population dynamics in vivo: implications for genetic variation, pathogenesis, and therapy. Science 267: 483–489. - PubMed
    1. Wolinsky SM, Korber BT, Neumann AU, Daniels M, Kunstman KJ, et al. (1996) Adaptive evolution of human immunodeficiency virus-type 1 during the natural course of infection. Science 272: 537–542. - PubMed
    1. Sanchez-Palomino S, Rojas JM, Martinez MA, Fenyö EM, Najera R, et al. (1993) Dilute passage promotes expression of genetic and phenotypic variants of human immunodeficiency virus type 1 in cell culture. J Virol 67 (5) 2938–2943. - PMC - PubMed
    1. Yuste E, Sanchez-Palomino S, Casado C, Domingo E, Lopez-Galindez C (1999) Drastic fitness loss in human immunodeficiency virus type 1 upon serial bottleneck events. J Virol 73 (4) 2745–2751. - PMC - PubMed
    1. Yuste E, Borderia AV, Domingo E, Lopez-Galindez C (2005) Few Mutations in the 5′ Leader Region Mediate Fitness Recovery of Debilitated Human Immunodeficiency Type 1 Viruses. J Virol 79: 5421–5427. - PMC - PubMed

Publication types