

Spontaneous, pro-arrhythmic calcium signals disrupt electrical pacing in mouse pulmonary vein sleeve cells
- PMID: 24586364
- PMCID: PMC3930634
- DOI: 10.1371/journal.pone.0088649
Spontaneous, pro-arrhythmic calcium signals disrupt electrical pacing in mouse pulmonary vein sleeve cells
Abstract
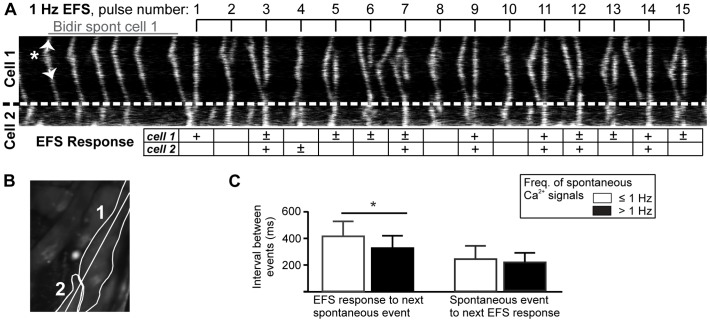
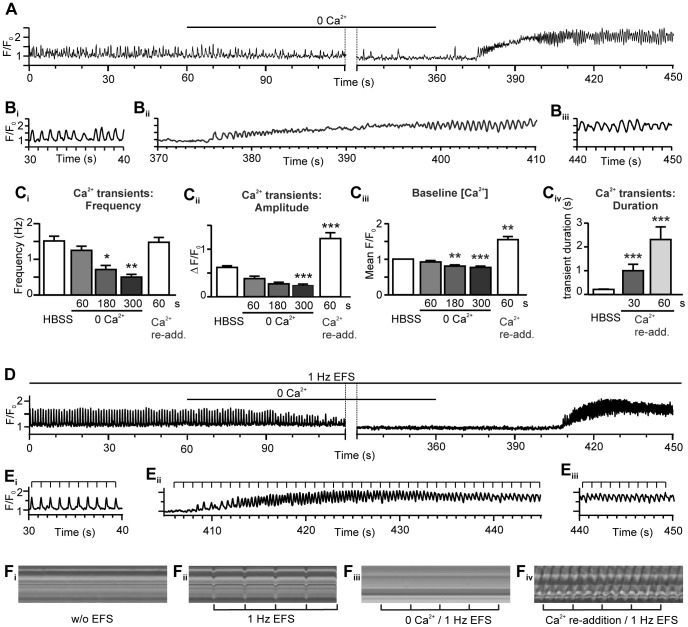
The pulmonary vein, which returns oxygenated blood to the left atrium, is ensheathed by a population of unique, myocyte-like cells called pulmonary vein sleeve cells (PVCs). These cells autonomously generate action potentials that propagate into the left atrial chamber and cause arrhythmias resulting in atrial fibrillation; the most common, often sustained, form of cardiac arrhythmia. In mice, PVCs extend along the pulmonary vein into the lungs, and are accessible in a lung slice preparation. We exploited this model to study how aberrant Ca(2+) signaling alters the ability of PVC networks to follow electrical pacing. Cellular responses were investigated using real-time 2-photon imaging of lung slices loaded with a Ca(2+)-sensitive fluorescent indicator (Ca(2+) measurements) and phase contrast microscopy (contraction measurements). PVCs displayed global Ca(2+) signals and coordinated contraction in response to electrical field stimulation (EFS). The effects of EFS relied on both Ca(2+) influx and Ca(2+) release, and could be inhibited by nifedipine, ryanodine or caffeine. Moreover, PVCs had a high propensity to show spontaneous Ca(2+) signals that arose via stochastic activation of ryanodine receptors (RyRs). The ability of electrical pacing to entrain Ca(2+) signals and contractile responses was dramatically influenced by inherent spontaneous Ca(2+) activity. In PVCs with relatively low spontaneous Ca(2+) activity (<1 Hz), entrainment with electrical pacing was good. However, in PVCs with higher frequencies of spontaneous Ca(2+) activity (>1.5 Hz), electrical pacing was less effective; PVCs became unpaced, only partially-paced or displayed alternans. Because spontaneous Ca(2+) activity varied between cells, neighboring PVCs often had different responses to electrical pacing. Our data indicate that the ability of PVCs to respond to electrical stimulation depends on their intrinsic Ca(2+) cycling properties. Heterogeneous spontaneous Ca(2+) activity arising from stochastic RyR opening can disengage them from sinus rhythm and lead to autonomous, pro-arrhythmic activity.
Conflict of interest statement
Figures


Similar articles
-
Pulmonary vein sleeve cell excitation-contraction-coupling becomes dysynchronized by spontaneous calcium transients.Biochem Soc Trans. 2015 Jun;43(3):410-6. doi: 10.1042/BST20140299. Biochem Soc Trans. 2015. PMID: 26009184 Review.
-
Decreased inward rectifying K+ current and increased ryanodine receptor sensitivity synergistically contribute to sustained focal arrhythmia in the intact rabbit heart.J Physiol. 2015 Mar 15;593(6):1479-93. doi: 10.1113/jphysiol.2014.279638. Epub 2014 Oct 7. J Physiol. 2015. PMID: 25772297 Free PMC article.
-
The contribution of inositol 1,4,5-trisphosphate and ryanodine receptors to agonist-induced Ca(2+) signaling of airway smooth muscle cells.Am J Physiol Lung Cell Mol Physiol. 2009 Aug;297(2):L347-61. doi: 10.1152/ajplung.90559.2008. Epub 2009 May 22. Am J Physiol Lung Cell Mol Physiol. 2009. PMID: 19465516 Free PMC article.
-
Spontaneous and electrically evoked Ca2+ transients in cardiomyocytes of the rat pulmonary vein.Cell Calcium. 2010 Aug-Sep;48(2-3):150-60. doi: 10.1016/j.ceca.2010.08.002. Cell Calcium. 2010. PMID: 20817251
-
Calcium signalling silencing in atrial fibrillation.J Physiol. 2017 Jun 15;595(12):4009-4017. doi: 10.1113/JP273045. Epub 2017 May 14. J Physiol. 2017. PMID: 28332202 Free PMC article. Review.
Cited by
-
Structural heterogeneity of the rat pulmonary vein myocardium: consequences on intracellular calcium dynamics and arrhythmogenic potential.Sci Rep. 2018 Feb 19;8(1):3244. doi: 10.1038/s41598-018-21671-9. Sci Rep. 2018. PMID: 29459735 Free PMC article.
-
Purinergic receptor stimulation induces calcium oscillations and smooth muscle contraction in small pulmonary veins.J Physiol. 2018 Jul;596(13):2491-2506. doi: 10.1113/JP274731. Epub 2018 May 23. J Physiol. 2018. PMID: 29790164 Free PMC article.
-
Atrial myocytes demonstrate the diversity of cardiac calcium signalling.Channels (Austin). 2015;9(5):219-20. doi: 10.1080/15384101.2015.1086203. Channels (Austin). 2015. PMID: 26542624 Free PMC article. No abstract available.
-
The vascular Ca2+-sensing receptor regulates blood vessel tone and blood pressure.Am J Physiol Cell Physiol. 2016 Feb 1;310(3):C193-204. doi: 10.1152/ajpcell.00248.2015. Epub 2015 Nov 4. Am J Physiol Cell Physiol. 2016. PMID: 26538090 Free PMC article.
-
Preferential Expression of Ca2+-Stimulable Adenylyl Cyclase III in the Supraventricular Area, including Arrhythmogenic Pulmonary Vein of the Rat Heart.Biomolecules. 2022 May 20;12(5):724. doi: 10.3390/biom12050724. Biomolecules. 2022. PMID: 35625651 Free PMC article.
References
-
- Bers DM (2002) Cardiac excitation-contraction coupling. Nature 415: 198–205. - PubMed
-
- Dobrzynski H, Anderson RH, Atkinson A, Borbas Z, D’Souza A, et al. (2013) Structure, function and clinical relevance of the cardiac conduction system, including the atrioventricular ring and outflow tract tissues. Pharmacol Ther 139: 260–288. - PubMed
-
- Berridge MJ (2003) Cardiac calcium signaling. Biochem Soc Trans 31: 930–933. - PubMed
-
- Niggli E (2011) Ryanodine receptors: waking up from refractoriness. Cardiovasc Res 91: 563–564. - PubMed
-
- Nattel S (2003) Atrial electrophysiology and mechanisms of atrial fibrillation. J Cardiovasc Pharmacol Ther 8 Suppl 1: S5–11. - PubMed
Publication types
MeSH terms
Substances
Grants and funding
LinkOut - more resources
Full Text Sources
Other Literature Sources
Medical
Miscellaneous
