. 2014 Feb 19;9(2):e88812.
doi: 10.1371/journal.pone.0088812. eCollection 2014.

Ischaemic strokes in patients with pulmonary arteriovenous malformations and hereditary hemorrhagic telangiectasia: associations with iron deficiency and platelets

Affiliations

Ischaemic strokes in patients with pulmonary arteriovenous malformations and hereditary hemorrhagic telangiectasia: associations with iron deficiency and platelets

Claire L Shovlin et al. PLoS One. .

Abstract

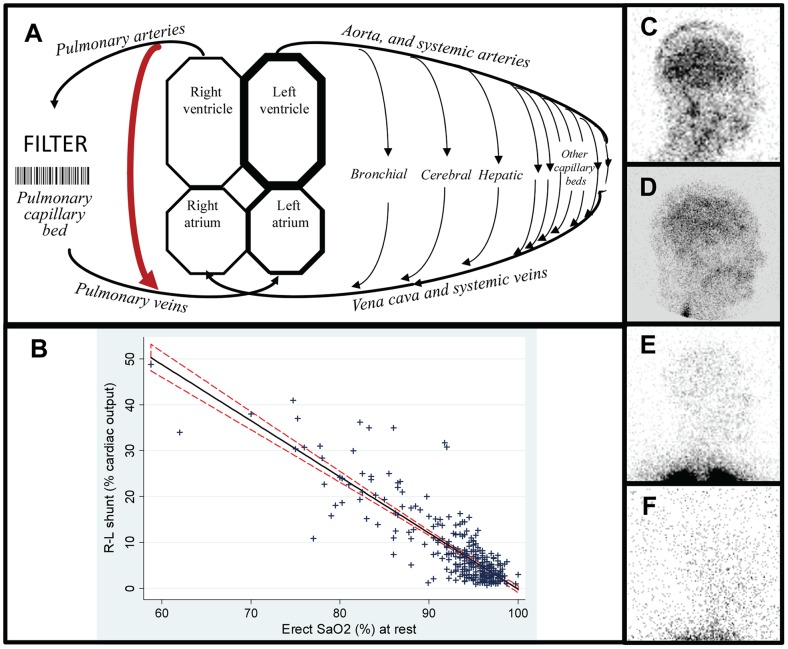
Background: Pulmonary first pass filtration of particles marginally exceeding ∼7 µm (the size of a red blood cell) is used routinely in diagnostics, and allows cellular aggregates forming or entering the circulation in the preceding cardiac cycle to lodge safely in pulmonary capillaries/arterioles. Pulmonary arteriovenous malformations compromise capillary bed filtration, and are commonly associated with ischaemic stroke. Cohorts with CT-scan evident malformations associated with the highest contrast echocardiographic shunt grades are known to be at higher stroke risk. Our goal was to identify within this broad grouping, which patients were at higher risk of stroke.

Methodology: 497 consecutive patients with CT-proven pulmonary arteriovenous malformations due to hereditary haemorrhagic telangiectasia were studied. Relationships with radiologically-confirmed clinical ischaemic stroke were examined using logistic regression, receiver operating characteristic analyses, and platelet studies.

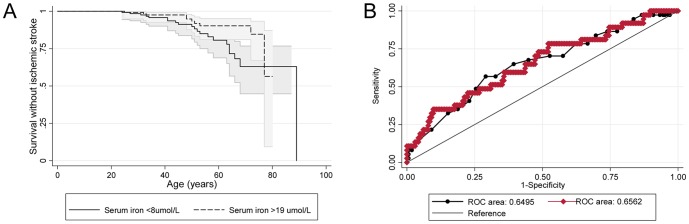
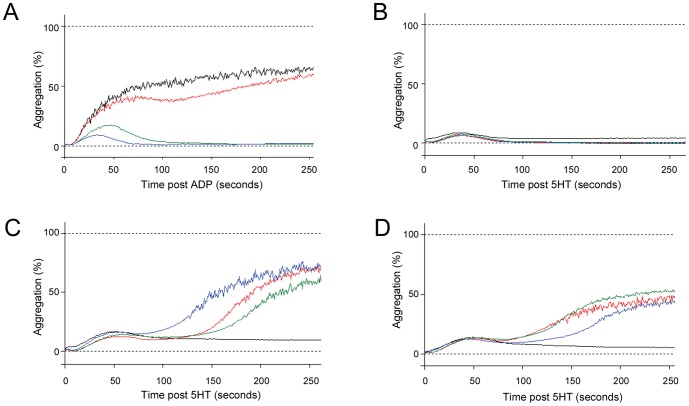
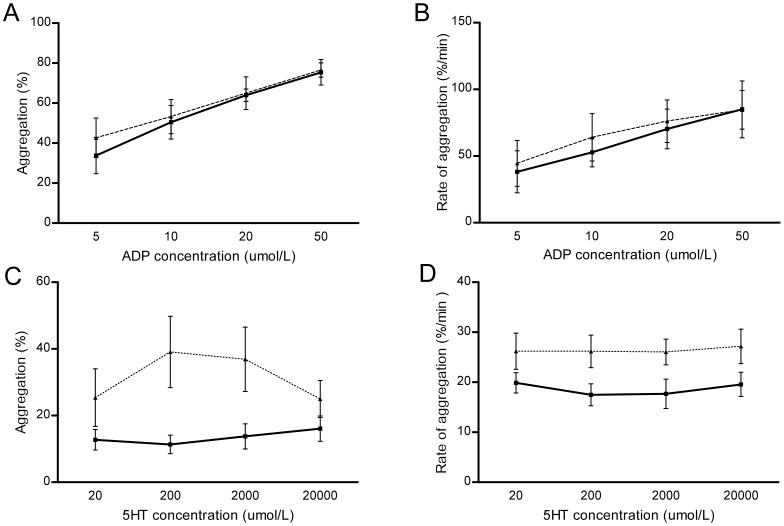
Principal findings: Sixty-one individuals (12.3%) had acute, non-iatrogenic ischaemic clinical strokes at a median age of 52 (IQR 41-63) years. In crude and age-adjusted logistic regression, stroke risk was associated not with venous thromboemboli or conventional neurovascular risk factors, but with low serum iron (adjusted odds ratio 0.96 [95% confidence intervals 0.92, 1.00]), and more weakly with low oxygen saturations reflecting a larger right-to-left shunt (adjusted OR 0.96 [0.92, 1.01]). For the same pulmonary arteriovenous malformations, the stroke risk would approximately double with serum iron 6 µmol/L compared to mid-normal range (7-27 µmol/L). Platelet studies confirmed overlooked data that iron deficiency is associated with exuberant platelet aggregation to serotonin (5HT), correcting following iron treatment. By MANOVA, adjusting for participant and 5HT, iron or ferritin explained 14% of the variance in log-transformed aggregation-rate (p = 0.039/p = 0.021).

Significance: These data suggest that patients with compromised pulmonary capillary filtration due to pulmonary arteriovenous malformations are at increased risk of ischaemic stroke if they are iron deficient, and that mechanisms are likely to include enhanced aggregation of circulating platelets.


Conflict of interest statement

Competing Interests: The authors have declared that no competing interests exist.

Figures

Figure 1
Figure 1. Right-to-left shunt and hypoxaemia evaluations.
A: Cartoon of the circulations indicating site of the pulmonary capillary filter, the dual pulmonary and bronchial/systemic arterial supply to lung tissue, and a pulmonary arteriovenous malformations (PAVM, red arrow). B: Relationship between quantified right-to-left shunt (measured using with 99mTc-labelled albumin macroaggregates (10–80 µm) or microspheres (7–25 µm)), with same-day oxygen saturation (SaO2), representing 309 paired values in 198 individuals since 1999. The linear regression coefficient of −1.22 (95% CI −1.31, −1.14; p<0.0001) indicates a strong relationship that explains 73% of the total variance in erect SaO2 (adjusted r2 0.73). The shunt explained a smaller proportion of the total variance in supine SaO2 (adjusted r2 0.54, data not shown). C–F: Representative right lateral brain images following injection of 99mTc-labelled albumin macroaggregates for shunt diagnosis and quantification: C) R-L shunt 48.8% of the cardiac output, associated with a resting SaO2 of 59%. D) R-L shunt 25%; SaO2 83%. E) R-L shunt 7.7%; SaO2 93.7%. Note the intense activity in the lung apices as expected. F) R-L shunt 3.3%; SaO2 96%. Note that the gain has been turned up but no cerebral activity is visible. This is the same individual as in D), with the images taken 6 months before (D) and 3 months after (F) embolisation which obliterated the causative PAVMs.
Figure 2
Figure 2. Stroke incidence.
A) Cumulative survival until first stroke: The solid line is modelled from the 129 patients with serum iron <8 µmol/L; dotted line from the 161 patients with serum iron >19 µmol/L. Shaded areas indicate 95% confidence intervals. B) Comparison of the stroke risk ROC models from myocardial infarction and serum iron (base model, black line/symbols), and strongest model generated from captured physiological variables, excluding the outcome measure of myocardial infarction (red line/symbols). The two models provide equivalent areas under the curve of 0.65 and 0·66 (p = 0.88). In the physiological ROC model, stroke risk was higher not only with lower serum iron (OR 0.95 [95% CI 0.90, 1.01]), but also with lower PAP(mean) (OR 0.94 [0.86, 1.03]); higher fibrinogen (OR 1.50 [0.95, 2.33]), lower SaO2 (OR 0.98 [95% CI 0.93, 1·03]), and in women (OR 1.57 [0.71, 3.47]).
Figure 3
Figure 3. Representative platelet dose response curves.
A) Typical control and iron deficient responses to ADP at 5 (blue), 10 (green), 20 (red) and 50 (black)µM. B) Typical control dose response curves to 5HT at 20 (blue), 200 (green), 2,000 (red) and 20,000 (black) µM–note the absence of the secondary wave of aggregation. C) Representative 5HT dose response curves displaying delayed secondary wave of aggregation observed in all severely iron deficient patients (hemoglobins 5.0–7.5 g/dl). The traces illustrated (5HT at 20 (blue), 200 (green), 2,000 (red) and 20,000 (black)) µM were from an individual with ferritin 4 µg/L, iron 3 µmol/l, hemoglobin 7.5 g/dl. D) Traces from the same individual as in (C), following a 6 month course of iron that resulted in improved iron indices (ferritin 31 µg/L, iron 7 µmol/l, hemoglobin 10.5 g/dl). Note that despite further treatments, iron deficiency persisted due to ongoing hemorrhagic losses. Aggregation curves are displayed for 5HT at 20 (black), 200 (green), 2,000 (red) and 20,000 (blue)µM.
Figure 4
Figure 4. Comparison of platelet dose response curves in response to agonists in iron deficient patients and controls.
Solid lines indicate controls; dotted lines represent the iron deficient group. Error bars represent standard error of the mean. A) Total aggregation in response to ADP at 5–50 µmol/L. B) Rate of aggregation in response to ADP. Since circulating blood should spend less than two seconds between pulmonary transits, the rate of aggregation may be particularly relevant. C) Total aggregation in response to 5HT. D) Rate of aggregation in response to 5HT.

Similar articles

Cited by

References

    1. Shovlin CL, Jackson JE (2010) Pulmonary arteriovenous malformations and other vascular abnormalities. In: Mason RJ, Broaddus VC, Martin T, et al. editors. Murray and Nadel's Textbook of Respiratory Medicine.5th Edn. Philadelphia, Elsevier-Saunders. pp. 1261–1282.
    1. Butler BD, Hills BA (1979) The lung as a filter for microbubbles. J Appl Physiol. 1979 47: 537–43. - PubMed
    1. Weibel ER (2009) What makes a good lung? The morphometric basis of lung function. Swiss Med Wkly 139 (27–28): 375–386. - PubMed
    1. Chilvers ER, Peters AM, George P, Hughes JMB, Allison DJ (1989) Quantification of right to left shunt through pulmonary arteriovenous malformations using 99Tcm albumin microspheres. Clin Radiol 39: 611–614. - PubMed
    1. Bajc M, Neilly JB, Miniati M, Schuemichen C, Meignan M, et al. (2009) EANM guidelines for ventilation/perfusion scintigraphy: Part 1. Pulmonary imaging with ventilation/perfusion single photon emission tomography. Eur J Nucl Med Mol Imaging 36: 1356–70. - PubMed

Publication types