

Single-cell resolution imaging of retinal ganglion cell apoptosis in vivo using a cell-penetrating caspase-activatable peptide probe
- PMID: 24586415
- PMCID: PMC3931650
- DOI: 10.1371/journal.pone.0088855
Single-cell resolution imaging of retinal ganglion cell apoptosis in vivo using a cell-penetrating caspase-activatable peptide probe
Abstract
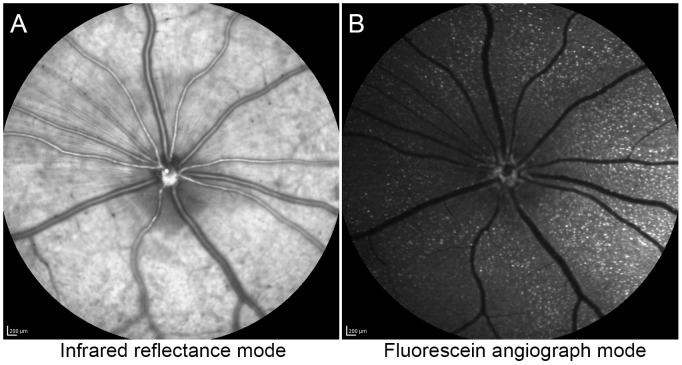
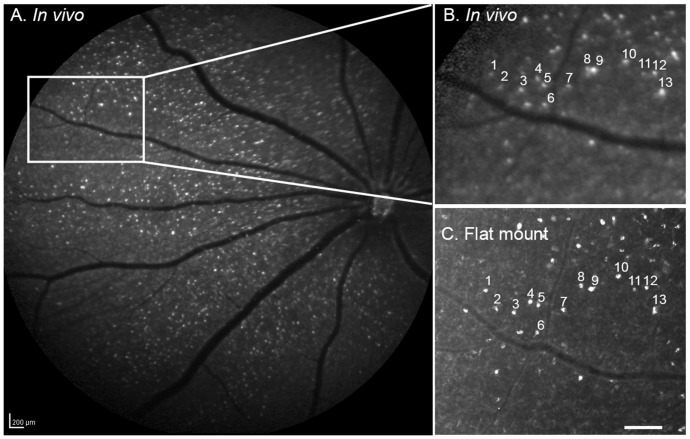
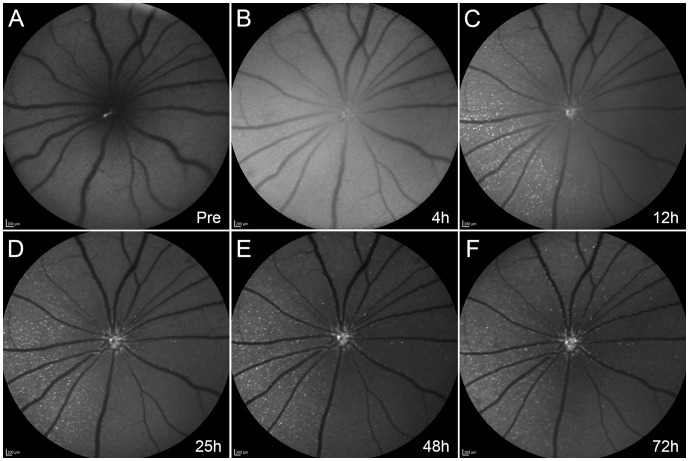
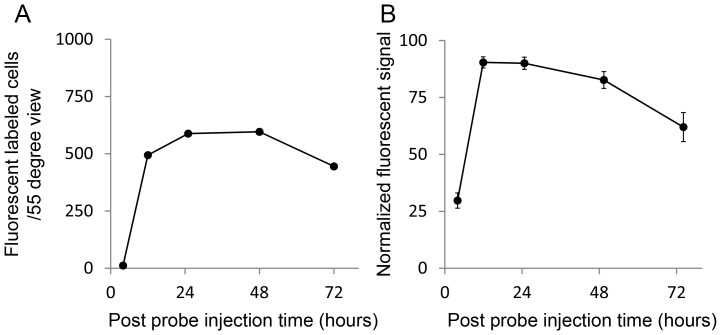
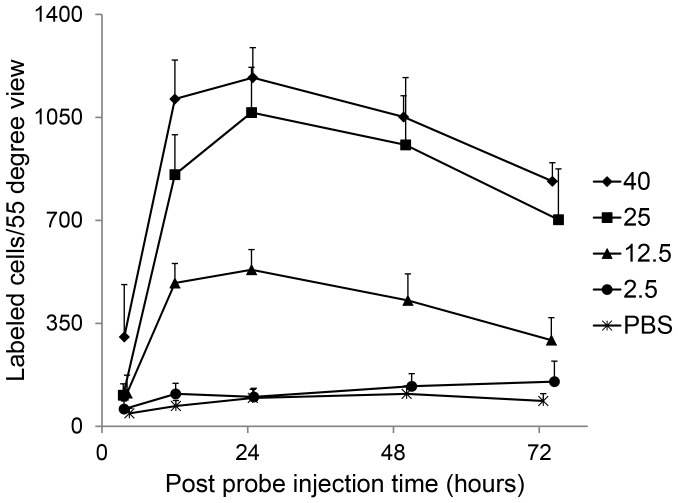
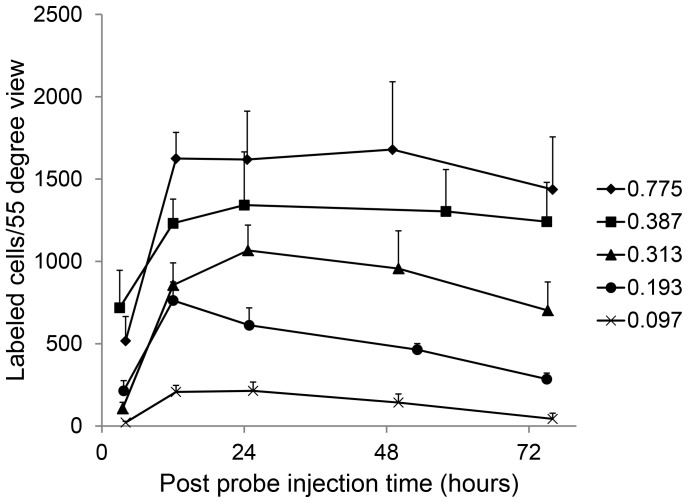
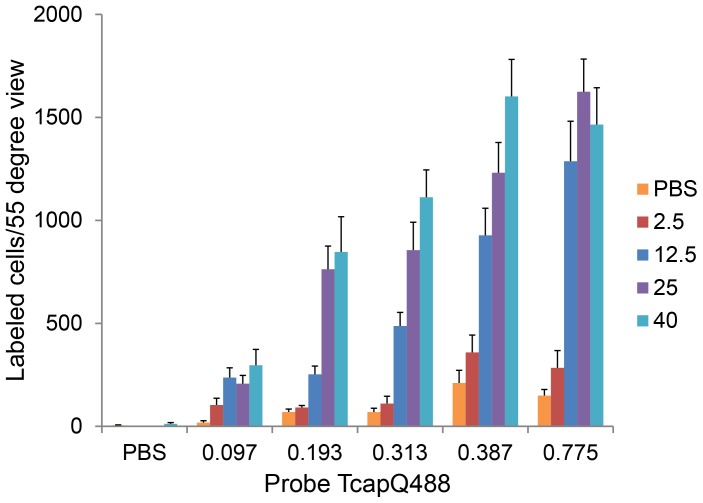
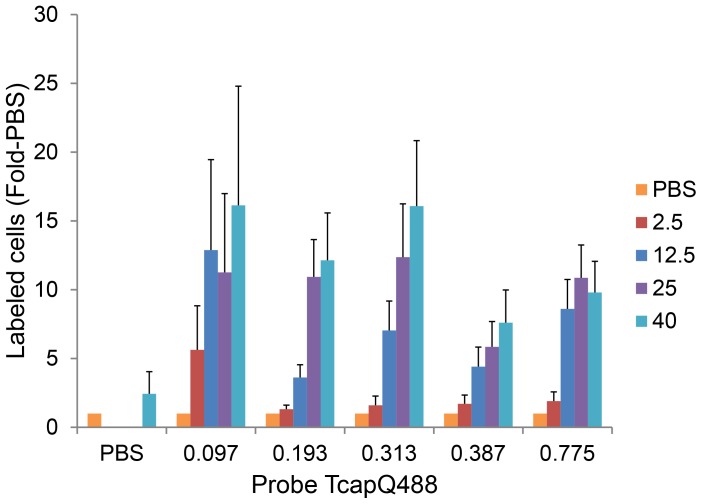
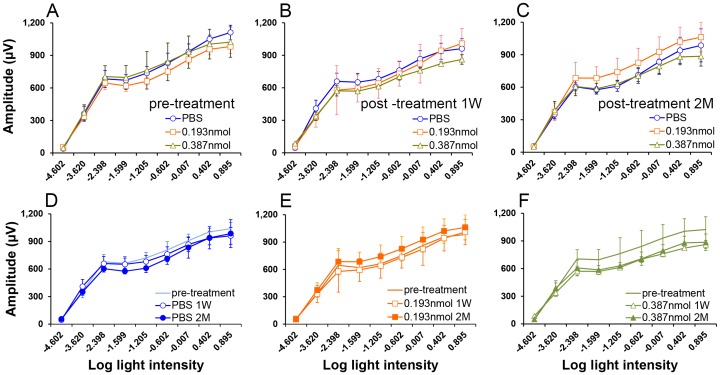
Peptide probes for imaging retinal ganglion cell (RGC) apoptosis consist of a cell-penetrating peptide targeting moiety and a fluorophore-quencher pair flanking an effector caspase consensus sequence. Using ex vivo fluorescence imaging, we previously validated the capacity of these probes to identify apoptotic RGCs in cell culture and in an in vivo rat model of N-methyl- D-aspartate (NMDA)-induced neurotoxicity. Herein, using TcapQ488, a new probe designed and synthesized for compatibility with clinically-relevant imaging instruments, and real time imaging of a live rat RGC degeneration model, we fully characterized time- and dose-dependent probe activation, signal-to-noise ratios, and probe safety profiles in vivo. Adult rats received intravitreal injections of four NMDA concentrations followed by varying TcapQ488 doses. Fluorescence fundus imaging was performed sequentially in vivo using a confocal scanning laser ophthalmoscope and individual RGCs displaying activated probe were counted and analyzed. Rats also underwent electroretinography following intravitreal injection of probe. In vivo fluorescence fundus imaging revealed distinct single-cell probe activation as an indicator of RGC apoptosis induced by intravitreal NMDA injection that corresponded to the identical cells observed in retinal flat mounts of the same eye. Peak activation of probe in vivo was detected 12 hours post probe injection. Detectable fluorescent RGCs increased with increasing NMDA concentration; sensitivity of detection generally increased with increasing TcapQ488 dose until saturating at 0.387 nmol. Electroretinography following intravitreal injections of TcapQ488 showed no significant difference compared with control injections. We optimized the signal-to-noise ratio of a caspase-activatable cell penetrating peptide probe for quantitative non-invasive detection of RGC apoptosis in vivo. Full characterization of probe performance in this setting creates an important in vivo imaging standard for functional evaluation of future probe analogues and provides a basis for extending this strategy into glaucoma-specific animal models.
Conflict of interest statement
Figures
Similar articles
-
In vivo scanning laser fundus and high-resolution OCT imaging of retinal ganglion cell injury in a non-human primate model with an activatable fluorescent-labeled TAT peptide probe.PLoS One. 2024 Dec 6;19(12):e0313579. doi: 10.1371/journal.pone.0313579. eCollection 2024. PLoS One. 2024. PMID: 39642160 Free PMC article.
-
An improved cell-penetrating, caspase-activatable, near-infrared fluorescent peptide for apoptosis imaging.Bioconjug Chem. 2009 Apr;20(4):702-9. doi: 10.1021/bc800516n. Bioconjug Chem. 2009. PMID: 19331388 Free PMC article.
-
Single-cell imaging of retinal ganglion cell apoptosis with a cell-penetrating, activatable peptide probe in an in vivo glaucoma model.Proc Natl Acad Sci U S A. 2009 Jun 9;106(23):9391-6. doi: 10.1073/pnas.0812884106. Epub 2009 May 20. Proc Natl Acad Sci U S A. 2009. PMID: 19458250 Free PMC article.
-
Ac-rkkrrorrrGK(QSY21)DEVDAPC(Alexa Fluor 647)-NH2.2008 Jan 23 [updated 2008 Apr 22]. In: Molecular Imaging and Contrast Agent Database (MICAD) [Internet]. Bethesda (MD): National Center for Biotechnology Information (US); 2004–2013. 2008 Jan 23 [updated 2008 Apr 22]. In: Molecular Imaging and Contrast Agent Database (MICAD) [Internet]. Bethesda (MD): National Center for Biotechnology Information (US); 2004–2013. PMID: 20641692 Free Books & Documents. Review.
-
Real-Time Imaging of Retinal Ganglion Cell Apoptosis.Cells. 2018 Jun 15;7(6):60. doi: 10.3390/cells7060060. Cells. 2018. PMID: 29914056 Free PMC article. Review.
Cited by
-
Exciting directions in glaucoma.Can J Ophthalmol. 2014 Dec;49(6):534-43. doi: 10.1016/j.jcjo.2014.08.007. Can J Ophthalmol. 2014. PMID: 25433744 Free PMC article. Review.
-
In vivo scanning laser fundus and high-resolution OCT imaging of retinal ganglion cell injury in a non-human primate model with an activatable fluorescent-labeled TAT peptide probe.PLoS One. 2024 Dec 6;19(12):e0313579. doi: 10.1371/journal.pone.0313579. eCollection 2024. PLoS One. 2024. PMID: 39642160 Free PMC article.
-
Imaging Retinal Ganglion Cell Death and Dysfunction in Glaucoma.Int Ophthalmol Clin. 2019 Fall;59(4):41-54. doi: 10.1097/IIO.0000000000000285. Int Ophthalmol Clin. 2019. PMID: 31569133 Free PMC article. Review. No abstract available.
-
A semi-automated technique for labeling and counting of apoptosing retinal cells.BMC Bioinformatics. 2014 Jun 5;15:169. doi: 10.1186/1471-2105-15-169. BMC Bioinformatics. 2014. PMID: 24902592 Free PMC article.
-
Tools and Biomarkers for the Study of Retinal Ganglion Cell Degeneration.Int J Mol Sci. 2022 Apr 13;23(8):4287. doi: 10.3390/ijms23084287. Int J Mol Sci. 2022. PMID: 35457104 Free PMC article. Review.
References
-
- Gross S, Piwnica-Worms D (2005) Spying on cancer: molecular imaging in vivo with genetically encoded reporters. Cancer Cell 7: 5–15. - PubMed
-
- Bullok K, Piwnica-Worms D (2005) Synthesis and characterization of a small, membrane-permeant, caspase-activatable far-red fluorescent peptide for imaging apoptosis. J Med Chem 48: 5404–5407. - PubMed
-
- Schoenberger J, Bauer J, Moosbauer J, Eilles C, Grimm D (2008) Innovative strategies in in vivo apoptosis imaging. Curr Med Chem 15: 187–194. - PubMed
Publication types
MeSH terms
Substances
Grants and funding
LinkOut - more resources
Full Text Sources
Other Literature Sources
