. 2014 Feb 25;9(2):e88897.
doi: 10.1371/journal.pone.0088897. eCollection 2014.

Spatial and temporal pattern of Rift Valley fever outbreaks in Tanzania; 1930 to 2007

Affiliations

Spatial and temporal pattern of Rift Valley fever outbreaks in Tanzania; 1930 to 2007

Calvin Sindato et al. PLoS One. .

Abstract

Background: Rift Valley fever (RVF)-like disease was first reported in Tanzania more than eight decades ago and the last large outbreak of the disease occurred in 2006-07. This study investigates the spatial and temporal pattern of RVF outbreaks in Tanzania over the past 80 years in order to guide prevention and control strategies.

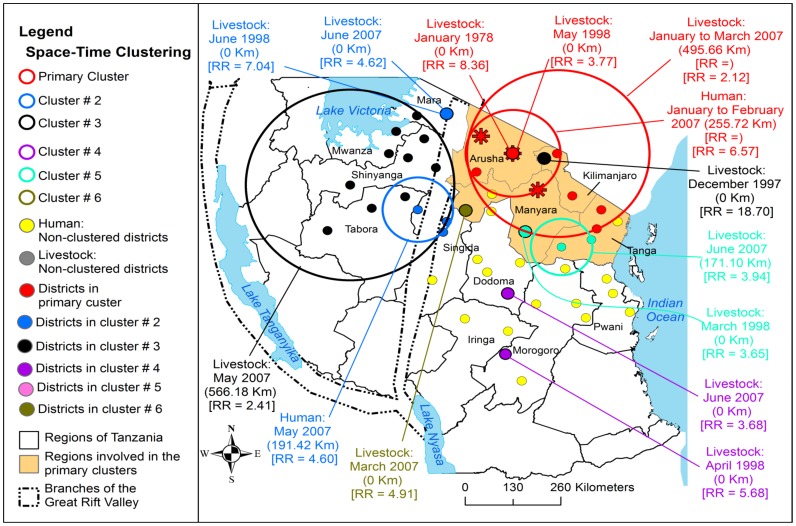
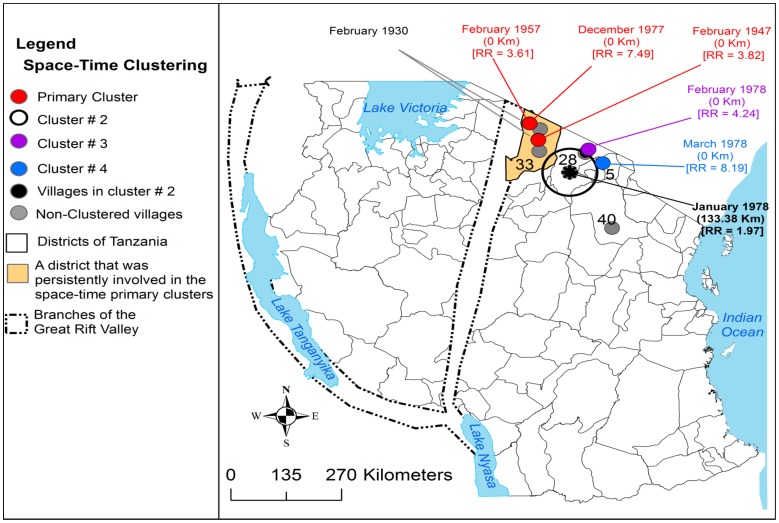
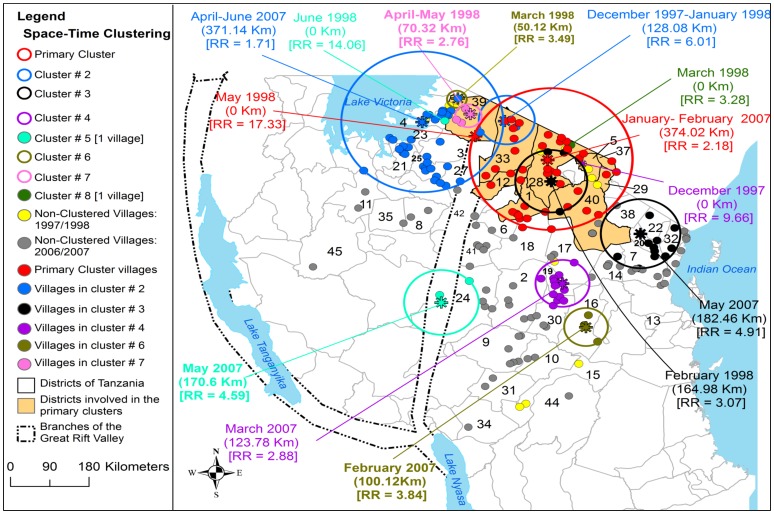
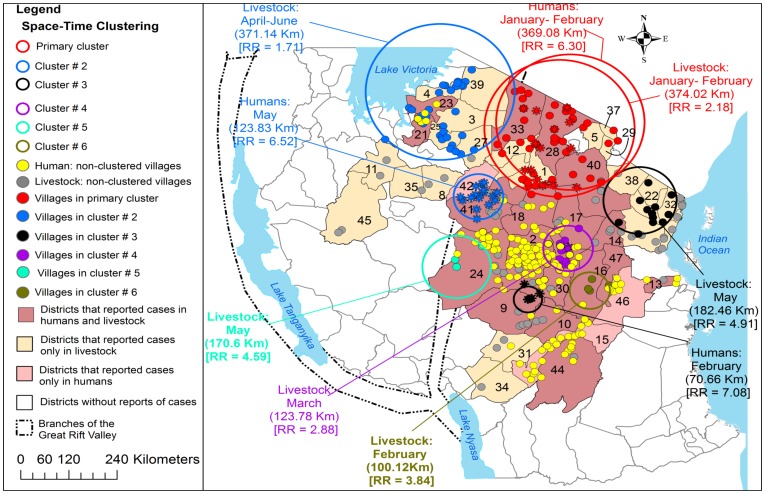
Materials and methods: A retrospective study was carried out based on disease reporting data from Tanzania at district or village level. The data were sourced from the Ministries responsible for livestock and human health, Tanzania Meteorological Agency and research institutions involved in RVF surveillance and diagnosis. The spatial distribution of outbreaks was mapped using ArcGIS 10. The space-time permutation model was applied to identify clusters of cases, and a multivariable logistic regression model was used to identify risk factors associated with the occurrence of outbreaks in the district.

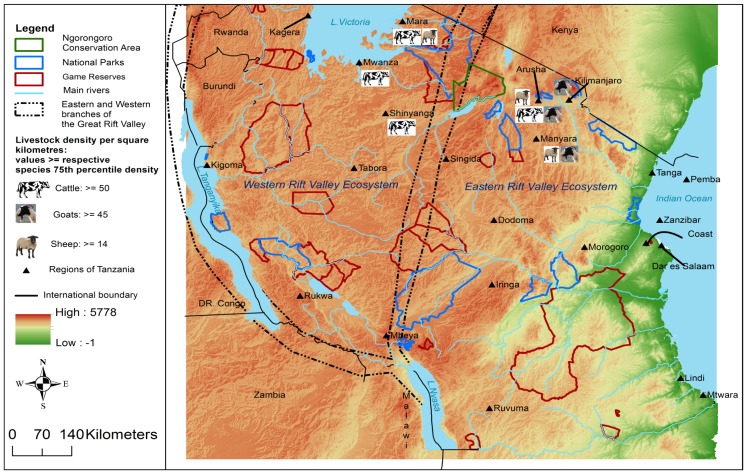
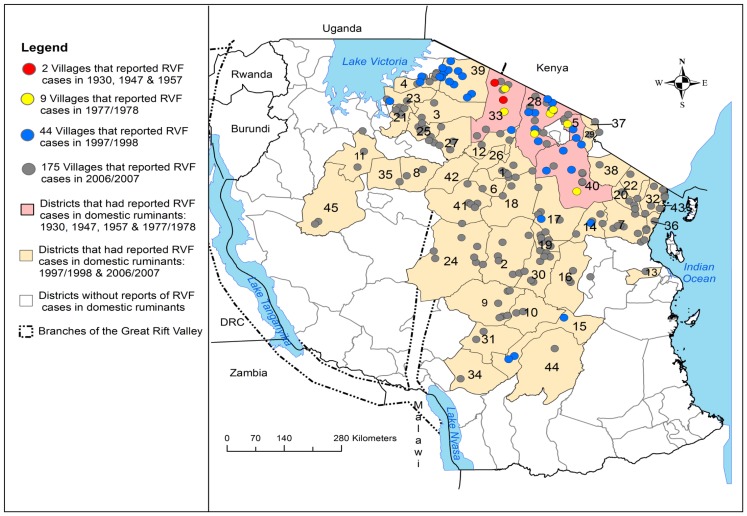
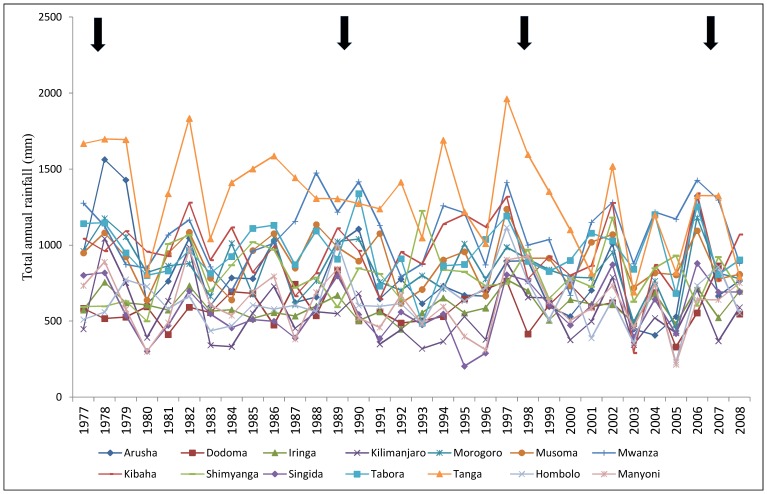
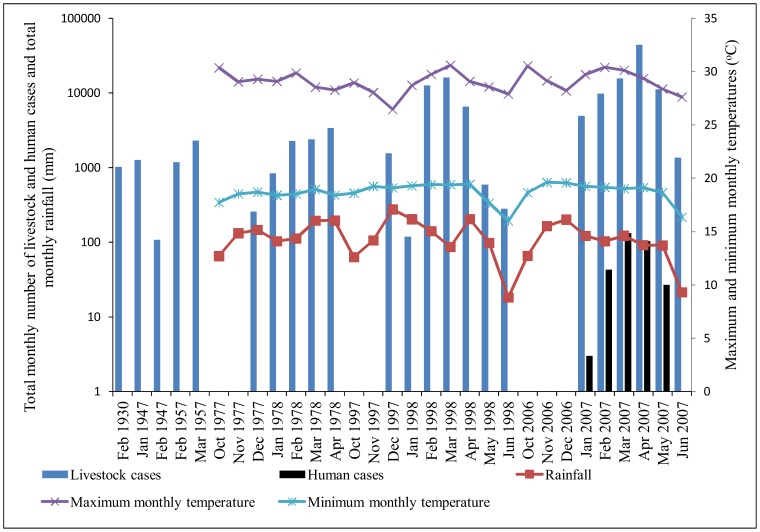
Principal findings: RVF outbreaks were reported between December and June in 1930, 1947, 1957, 1960, 1963, 1968, 1977-79, 1989, 1997-98 and 2006-07 in 39.2% of the districts in Tanzania. There was statistically significant spatio-temporal clustering of outbreaks. RVF occurrence was associated with the eastern Rift Valley ecosystem (OR = 6.14, CI: 1.96, 19.28), total amount of rainfall of >405.4 mm (OR = 12.36, CI: 3.06, 49.88), soil texture (clay [OR = 8.76, CI: 2.52, 30.50], and loam [OR = 8.79, CI: 2.04, 37.82]).

Conclusion/significance: RVF outbreaks were found to be distributed heterogeneously and transmission dynamics appeared to vary between areas. The sequence of outbreak waves, continuously cover more parts of the country. Whenever infection has been introduced into an area, it is likely to be involved in future outbreaks. The cases were more likely to be reported from the eastern Rift Valley than from the western Rift Valley ecosystem and from areas with clay and loam rather than sandy soil texture.


Conflict of interest statement

Competing Interests: The authors have declared that no competing interests exist.

Figures

Figure 1
Figure 1. Digital elevation map of Tanzania and main features.
Map of Tanzania showing the elevation (metres above sea level), Eastern and Western Great Rift Valley ecosystems (dashed-dot lines), main regions, main rivers, National Parks, Game Reserves, Ngorongoro Conservation Area, international borders and neighbouring countries. Rift Valley fever occurrence is associated with the Great Rift Valley. The animal symbols on the map indicate the areas where the density is equal to and above the threshold mentioned in the legend. Livestock density is higher in the plateau of the northern and lake zones of the country.
Figure 2
Figure 2. The space-time progression of Rift Valley fever outbreaks by district and villages; 1930 to 2007.
Ngorongoro, Simanjiro, Monduli and Hai are the only districts in the eastern Rift Valley ecosystem that were involved in the outbreaks from 1930 to 1978. These four districts were persistently involved in subsequent outbreaks from 1997 to 2007 that had expanded progressively to east-south and western parts of the country.
Figure 3
Figure 3. Rainfall curves showing annual total rainfall in millimetres for the zones in Tanzania.
The zones represented by regions (in parenthses) are: The Northeastern zone (Arusha, Kilimanjaro, Tanga, Morogoro and Kibaha stations); Central zone (Dodoma, Hombolo, Singida and Manyoni stations); Western zone (Tabora station); Lake zone (Mwanza, Shinyanga and Musoma stations); Southern highland zone (Iringa station). The arrows indicate the years of RVF outbreak waves in Tanzania from 1977 to 2008.
Figure 4
Figure 4. Curves showing the pattern of total monthly rainfall, temperature and RVF outbreaks waves.
The onset of outbreaks in domestic ruminants [1977 to 2006/2007] and humans [2006/2007] were preceded by about two months rainful surplus. Clear pattern between the monthly tempearure and onset of outbreaks was not observed. The outbreaks had a tendency to cease as the rainfall faded-off. Left Y axis corresponds to total monthly rainfall in millimetres (mm) and total monthly number of livestock and humans cases. The right Y axis corresponds to the maximum and minimum monthly temperatures. The X axis corresponds to the months and years of RVF outbreak waves.
Figure 5
Figure 5. Distribution of district level space-time clusters of RVF cases in domestic ruminants and humans.
The outbreak waves in 1930, 1947 and 1957 were persistently reported in one district in Arusha region. This figure indicates the persistence spatiotemporal overlapping of the livestock and human primary clusters. During the latest outbreak in 2006/2007, the primary and secondary human clusters had occurred within the respective primary and secondary livestock clusters. Asterisks correspond to districts that were included within the human primary cluster; relative risk for each cluster is displayed (RR) along with the buffer (circle) size in kilometres (km).
Figure 6
Figure 6. Distribution of village-level space-time clusters of RVF cases from 1947 to 1978.
There were no clusters detected in 1930; from 1947 to 1978 three primary clusters were persistently detected in Ngorongoro district, each involving one village. An asterisk represents the centre of cluster that involved more than one village; relative risk for each cluster is displayed (RR) along with the buffer (circle) size in kilometres (km).
Figure 7
Figure 7. Distribution of village-level space-time clusters of RVF cases in domestic ruminants from 1997 to 2007.
Asterisks represent the centre of clusters; relative risk for each cluster is displayed (RR) along with the buffer (circle) size in kilometres (km). The primary cluster was detected within the epicentre district (Ngorongoro) in the northern zone during the 1997/1998 outbreak wave. Nine districts formed the primary cluster including the epicentre district during the 2006/2007 outbreak wave that had expanded towards the south-west.
Figure 8
Figure 8. Distribution of village-level space-time clusters of RVF cases in humans and domestic ruminants.
During the 2006/2007 outbreak wave the analysis of clustering of cases was made separately for humans and domestic ruminants. Between January and February 2007 there was an overlap of livestock and human primary clusters in the same location. Asterisks correspond to villages that were included within human space-time clusters; Relative risk for each cluster is displayed (RR) along with the buffer (circle) size in kilometres (km).

References

    1. Flick R, Bouloy R (2005) Rift Valley Fever Virus. Curr. Mol. Med 5: 827–834. - PubMed
    1. Murphy FA, Gibbs EPJ, Horzinek MC, Studdert MJ (1999) Veterinary Virology. USA: Elsevier 469–475.
    1. Rich KM, Wanyoike F (2010) An assessment of the regional and national socioeconomic impacts of the 2007 Rift Valley fever outbreak in Kenya. Am J Trop Med Hyg 83: 52–57. - PMC - PubMed
    1. Dar O, McIntyre S, Hogarth S, Heymann D (2013) Rift Valley fever and a new paradigm of research and development for zoonotic disease control. Emerg Infect Dis. 19(2): 189–193. - PMC - PubMed
    1. Chevalier V, Lancelot R, Thiongane Y, Sall B, Diaite A, et al. (2005) Rift Valley fever in small ruminants, Senegal, 2003. Emerg Infect Dis 11: 1693–1700. - PMC - PubMed

Publication types

LinkOut - more resources