

Mitochondrial respiratory function induces endogenous hypoxia
- PMID: 24586439
- PMCID: PMC3931703
- DOI: 10.1371/journal.pone.0088911
Mitochondrial respiratory function induces endogenous hypoxia
Abstract
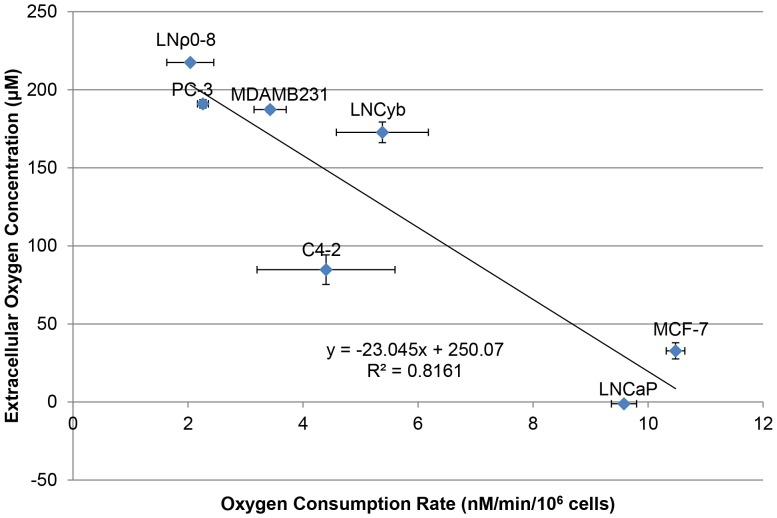
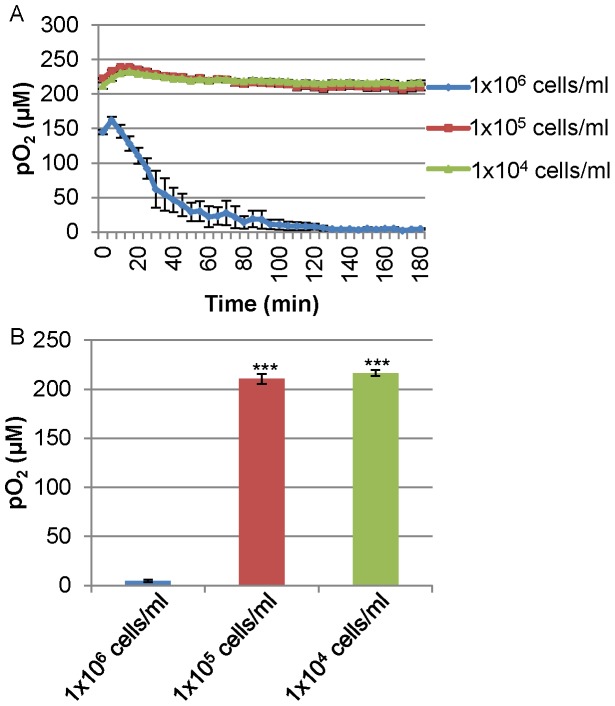
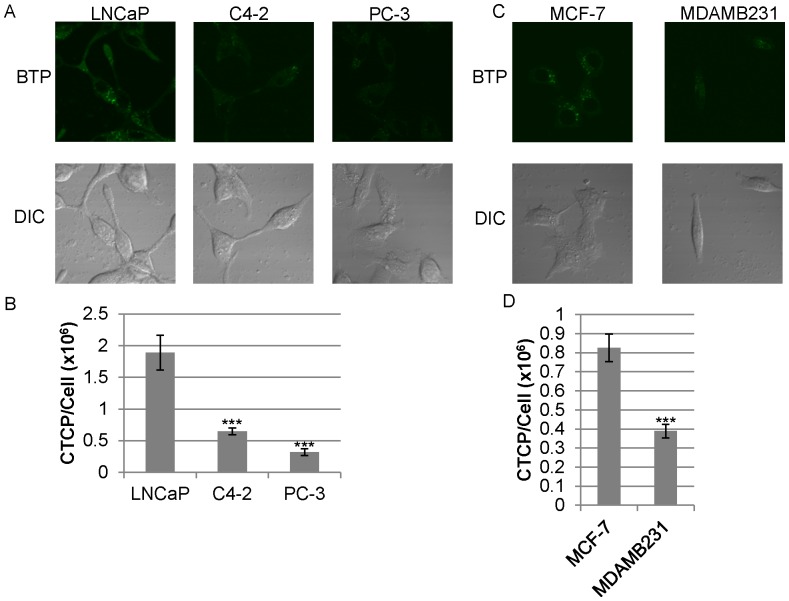
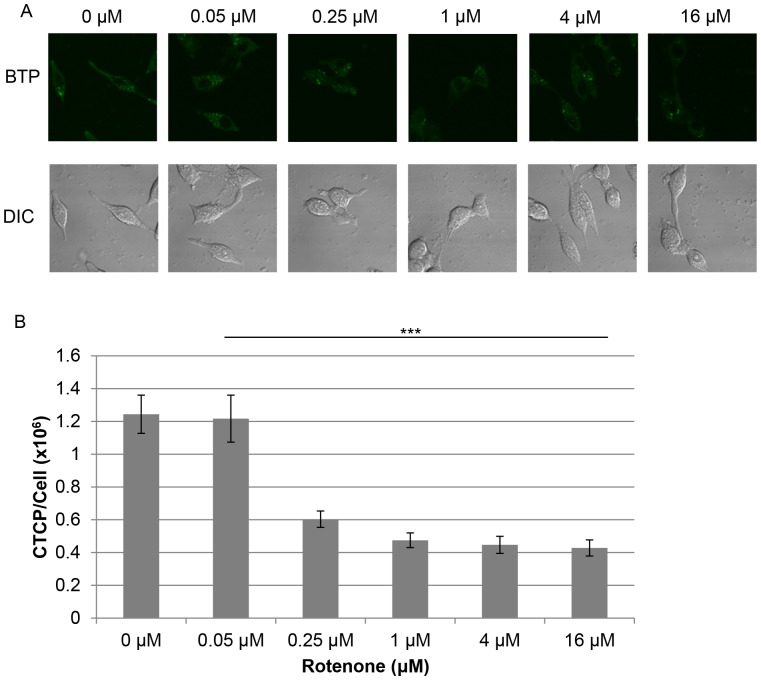
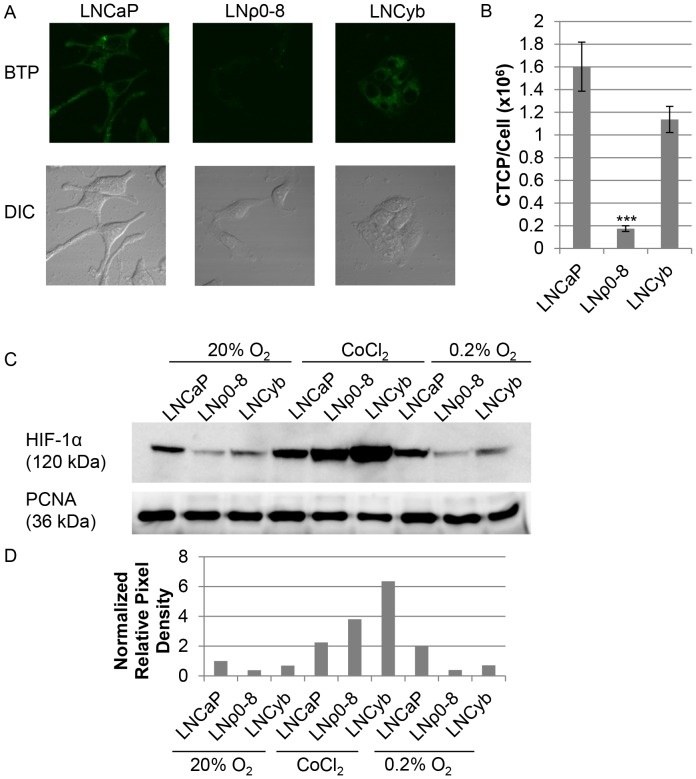
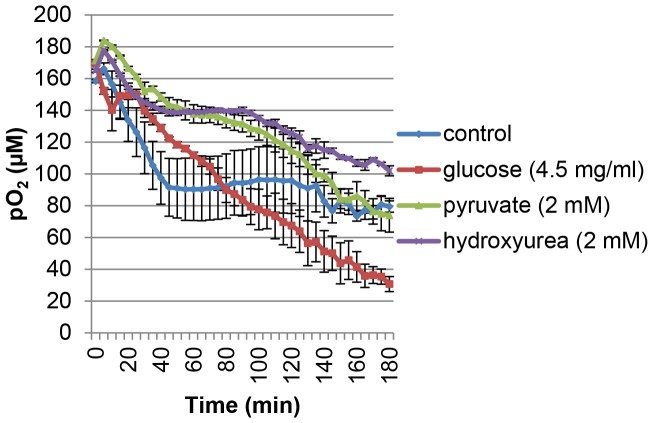
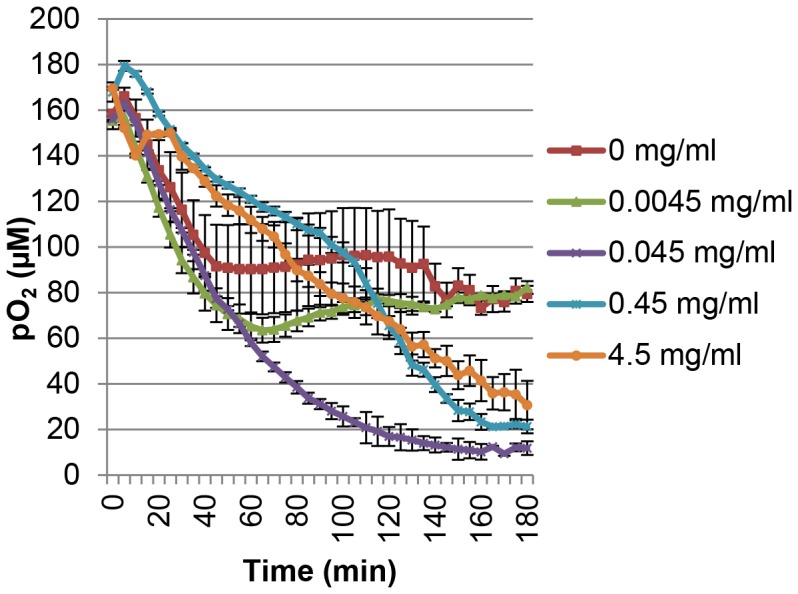
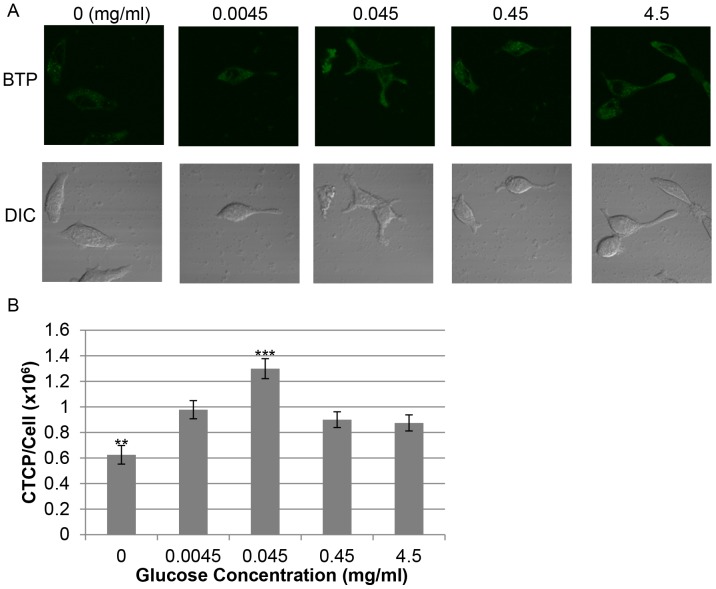
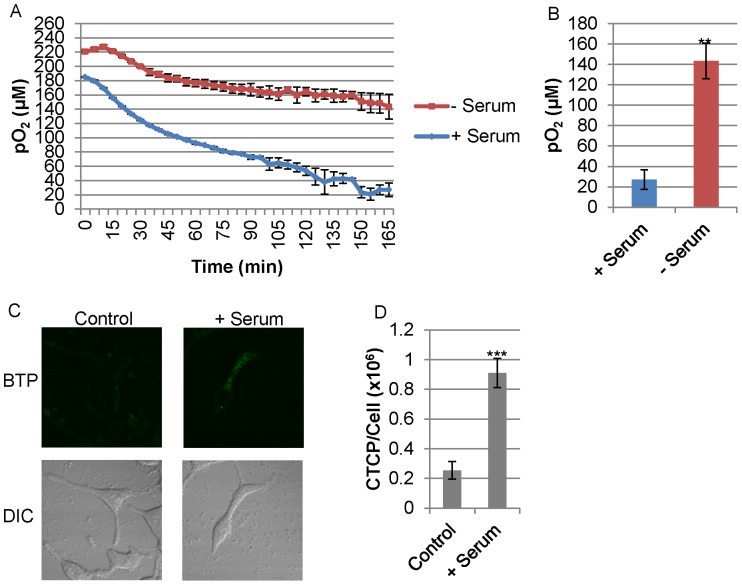
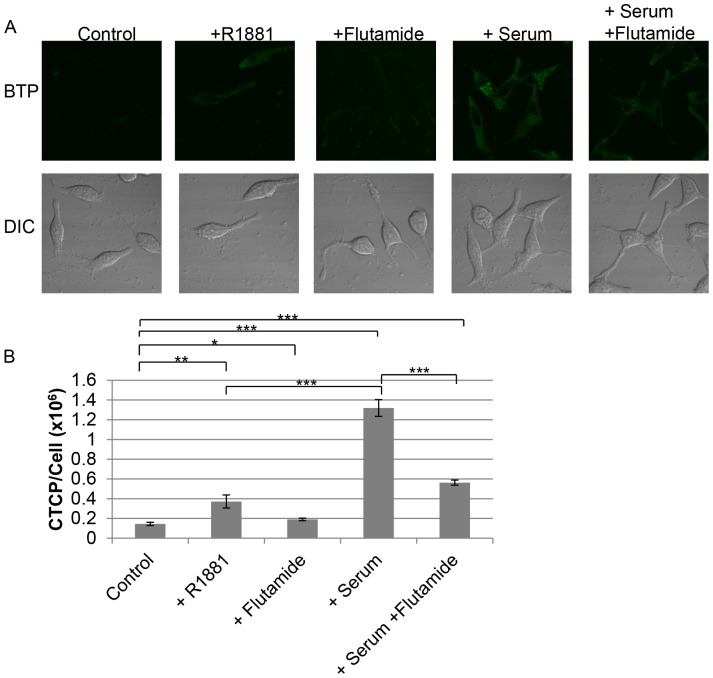
Hypoxia influences many key biological functions. In cancer, it is generally believed that hypoxic condition is generated deep inside the tumor because of the lack of oxygen supply. However, consumption of oxygen by cancer should be one of the key means of regulating oxygen concentration to induce hypoxia but has not been well studied. Here, we provide direct evidence of the mitochondrial role in the induction of intracellular hypoxia. We used Acetylacetonatobis [2-(2'-benzothienyl) pyridinato-kN, kC3'] iridium (III) (BTP), a novel oxygen sensor, to detect intracellular hypoxia in living cells via microscopy. The well-differentiated cancer cell lines, LNCaP and MCF-7, showed intracellular hypoxia without exogenous hypoxia in an open environment. This may be caused by high oxygen consumption, low oxygen diffusion in water, and low oxygen incorporation to the cells. In contrast, the poorly-differentiated cancer cell lines: PC-3 and MDAMB231 exhibited intracellular normoxia by low oxygen consumption. The specific complex I inhibitor, rotenone, and the reduction of mitochondrial DNA (mtDNA) content reduced intracellular hypoxia, indicating that intracellular oxygen concentration is regulated by the consumption of oxygen by mitochondria. HIF-1α was activated in endogenously hypoxic LNCaP and the activation was dependent on mitochondrial respiratory function. Intracellular hypoxic status is regulated by glucose by parabolic dose response. The low concentration of glucose (0.045 mg/ml) induced strongest intracellular hypoxia possibly because of the Crabtree effect. Addition of FCS to the media induced intracellular hypoxia in LNCaP, and this effect was partially mimicked by an androgen analog, R1881, and inhibited by the anti-androgen, flutamide. These results indicate that mitochondrial respiratory function determines intracellular hypoxic status and may regulate oxygen-dependent biological functions.
Conflict of interest statement
Figures


Similar articles
-
Hypoxic but not anoxic stabilization of HIF-1alpha requires mitochondrial reactive oxygen species.Am J Physiol Lung Cell Mol Physiol. 2002 Nov;283(5):L922-31. doi: 10.1152/ajplung.00014.2002. Am J Physiol Lung Cell Mol Physiol. 2002. PMID: 12376345
-
Mitochondrial bioenergetics of metastatic breast cancer cells in response to dynamic changes in oxygen tension: effects of HIF-1α.PLoS One. 2013 Jun 28;8(6):e68348. doi: 10.1371/journal.pone.0068348. Print 2013. PLoS One. 2013. PMID: 23840849 Free PMC article.
-
Regulation of hypoxia-inducible factor is preserved in the absence of a functioning mitochondrial respiratory chain.Blood. 2001 Jul 15;98(2):296-302. doi: 10.1182/blood.v98.2.296. Blood. 2001. PMID: 11435296
-
Sensors, transmitters, and targets in mitochondrial oxygen shortage-a hypoxia-inducible factor relay story.Antioxid Redox Signal. 2014 Jan 10;20(2):339-52. doi: 10.1089/ars.2012.4776. Epub 2012 Sep 6. Antioxid Redox Signal. 2014. PMID: 22794181 Review.
-
Oxygen conformance of cellular respiration. A perspective of mitochondrial physiology.Adv Exp Med Biol. 2003;543:39-55. doi: 10.1007/978-1-4419-8997-0_4. Adv Exp Med Biol. 2003. PMID: 14713113 Review.
Cited by
-
Oncostatic-Cytoprotective Effect of Melatonin and Other Bioactive Molecules: A Common Target in Mitochondrial Respiration.Int J Mol Sci. 2016 Mar 7;17(3):341. doi: 10.3390/ijms17030341. Int J Mol Sci. 2016. PMID: 26959015 Free PMC article. Review.
-
The oxygen level in air directs airway epithelial cell differentiation by controlling mitochondrial citrate export.Sci Adv. 2025 Jan 24;11(4):eadr2282. doi: 10.1126/sciadv.adr2282. Epub 2025 Jan 24. Sci Adv. 2025. PMID: 39854459 Free PMC article.
-
Oxaloacetate enhances and accelerates regeneration in young mice by promoting proliferation and mineralization.Front Cell Dev Biol. 2023 Feb 24;11:1117836. doi: 10.3389/fcell.2023.1117836. eCollection 2023. Front Cell Dev Biol. 2023. PMID: 36910154 Free PMC article.
-
Intracellular Oxygen Concentration Determined By Mitochondrial Respiration Regulates Production of Reactive Oxygen Species.Integr Cancer Biol Res. 2017;1(1):006. Integr Cancer Biol Res. 2017. PMID: 30637413 Free PMC article.
-
The Oncojanus Paradigm of Respiratory Complex I.Genes (Basel). 2018 May 7;9(5):243. doi: 10.3390/genes9050243. Genes (Basel). 2018. PMID: 29735924 Free PMC article. Review.
References
-
- Semenza GL (2001) Hypoxia-inducible factor 1: oxygen homeostasis and disease pathophysiology. Trends Mol Med 7: 345–350. - PubMed
-
- Fradette C, Du Souich P (2004) Effect of hypoxia on cytochrome P450 activity and expression. Curr Drug Metab 5: 257–271. - PubMed
-
- Nguyen AD, McDonald JG, Bruick RK, DeBose-Boyd RA (2007) Hypoxia stimulates degradation of 3-hydroxy-3-methylglutaryl-coenzyme A reductase through accumulation of lanosterol and hypoxia-inducible factor-mediated induction of insigs. Journal of Biological Chemistry 282: 27436–27446. - PubMed
Publication types
MeSH terms
Substances
Grants and funding
LinkOut - more resources
Full Text Sources
Other Literature Sources
