. 2014 Feb 19;9(2):e88964.
doi: 10.1371/journal.pone.0088964. eCollection 2014.

Improvement of chloride transport defect by gonadotropin-releasing hormone (GnRH) in cystic fibrosis epithelial cells

Affiliations

Improvement of chloride transport defect by gonadotropin-releasing hormone (GnRH) in cystic fibrosis epithelial cells

Nathalie Benz et al. PLoS One. .

Abstract

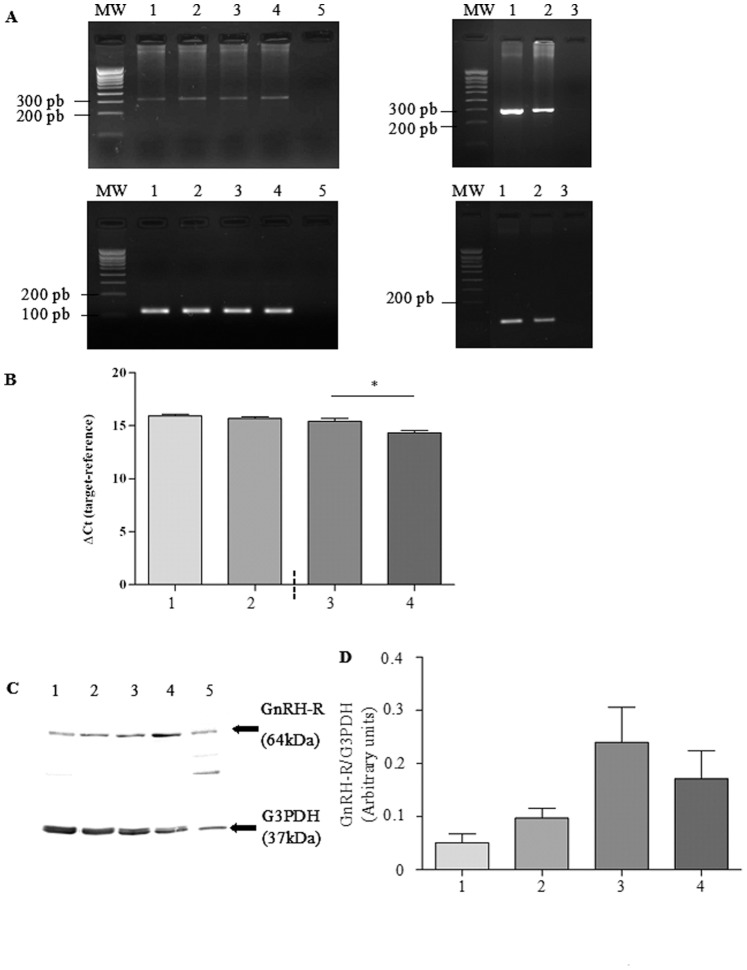
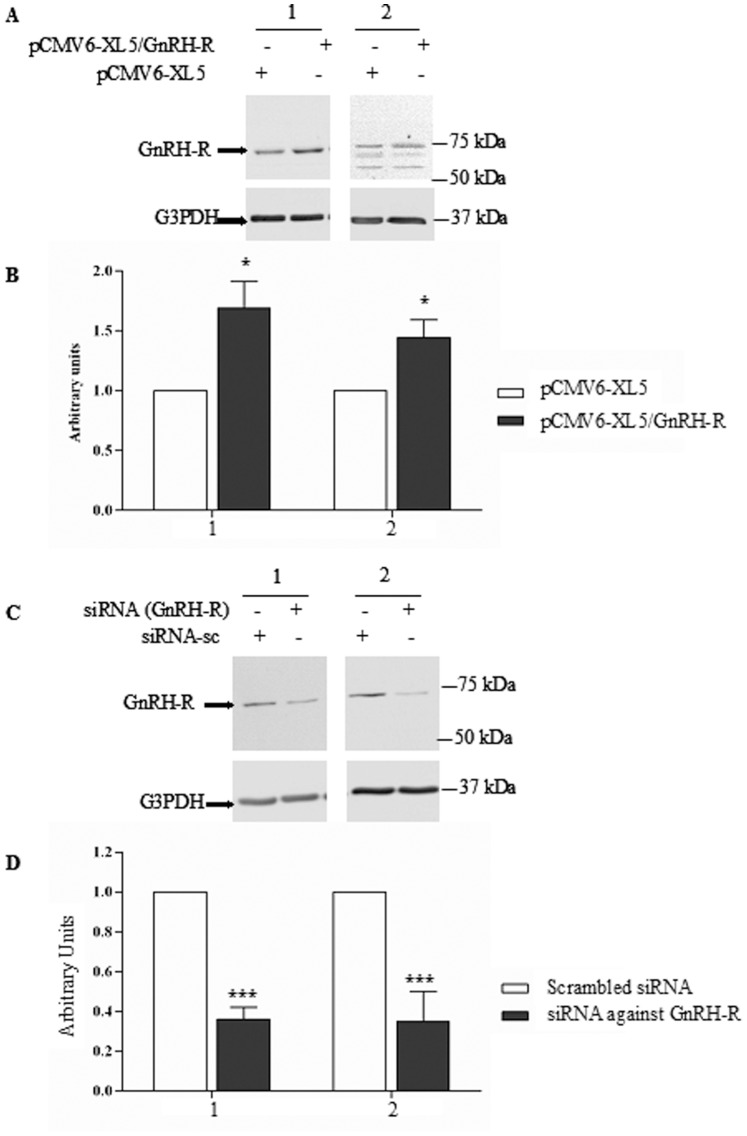
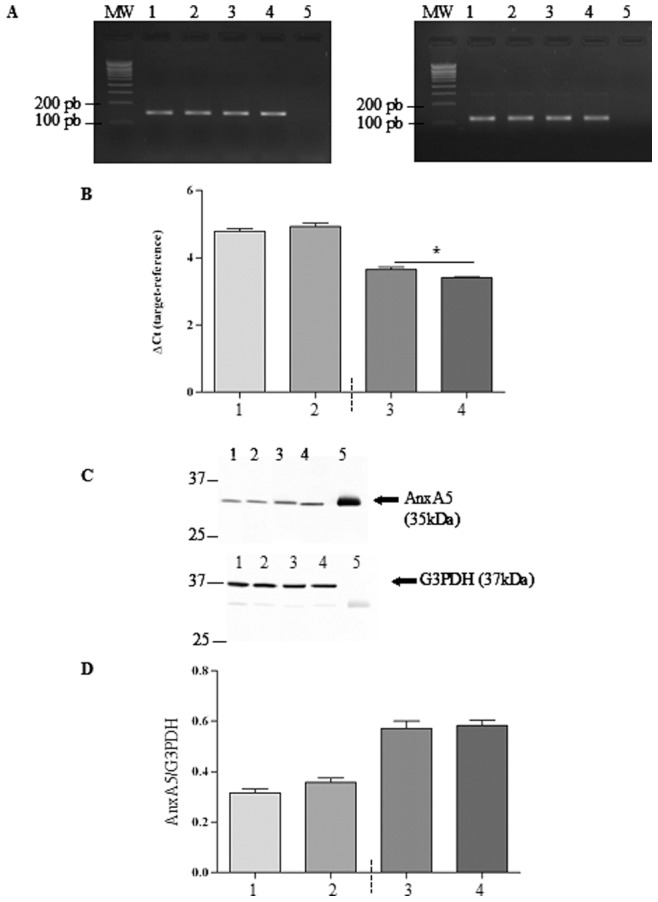
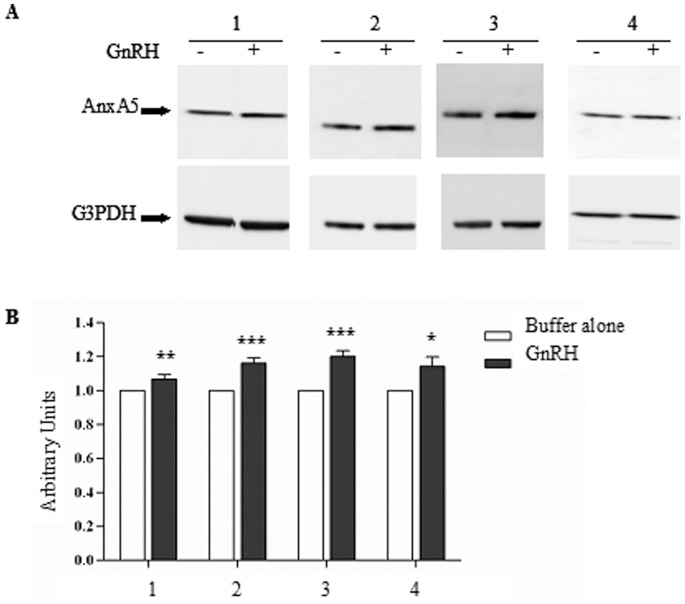
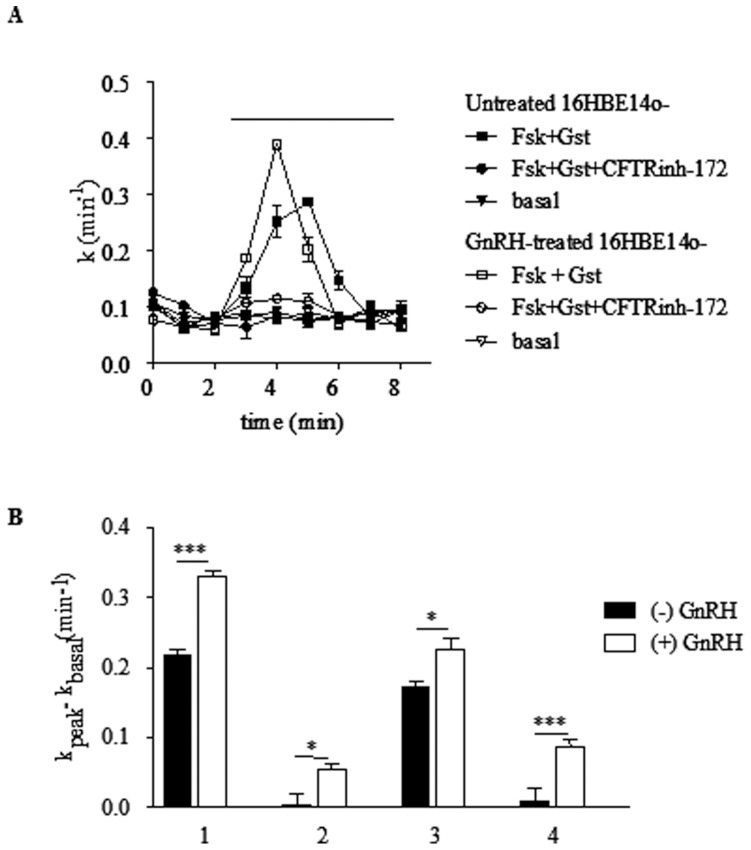
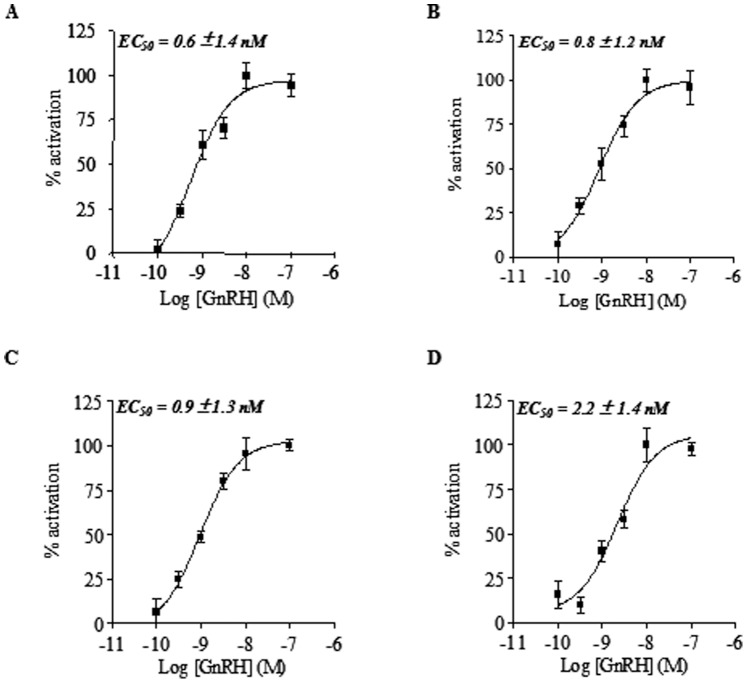
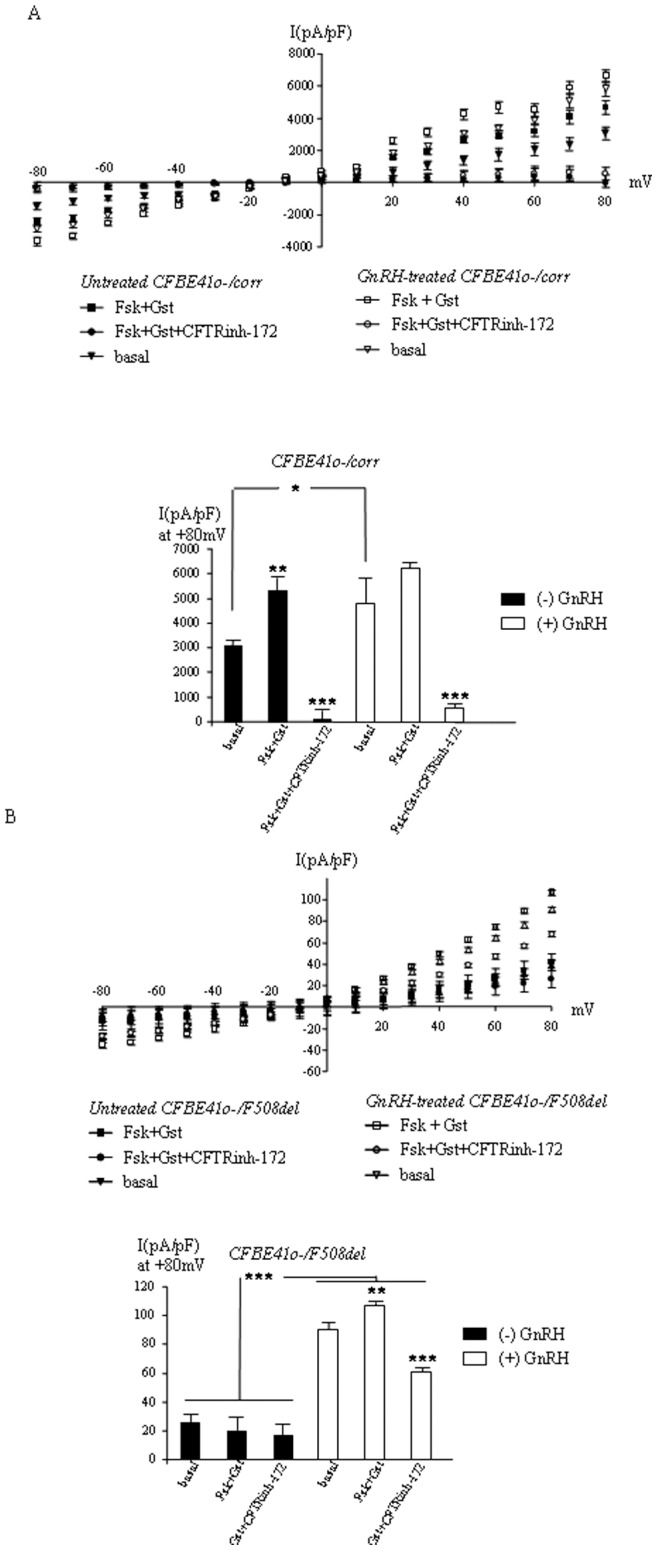
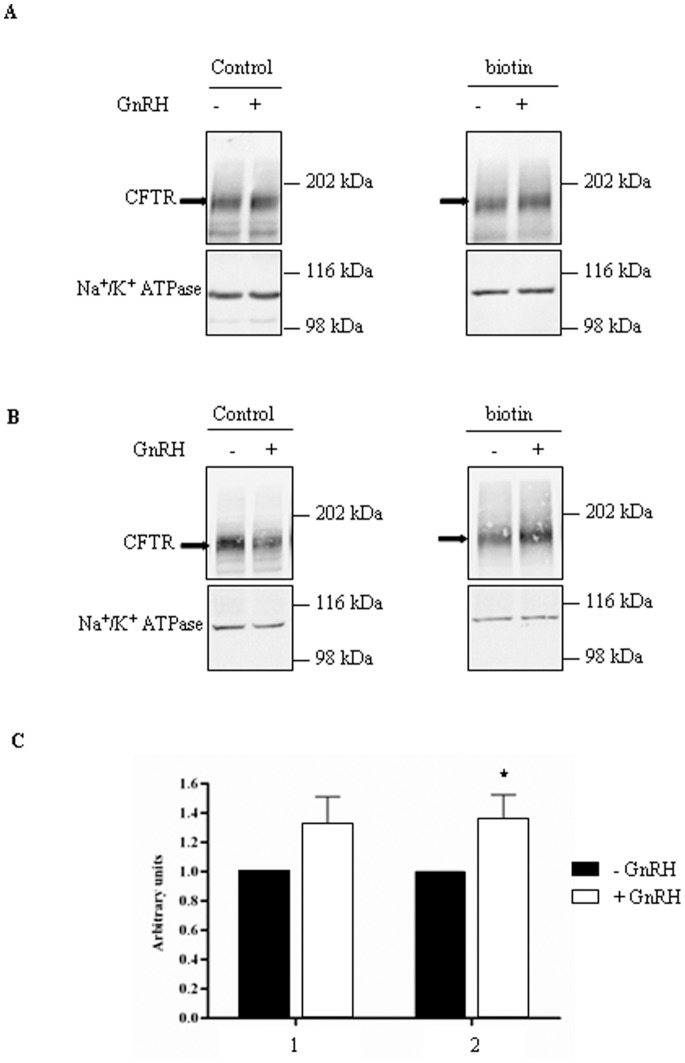
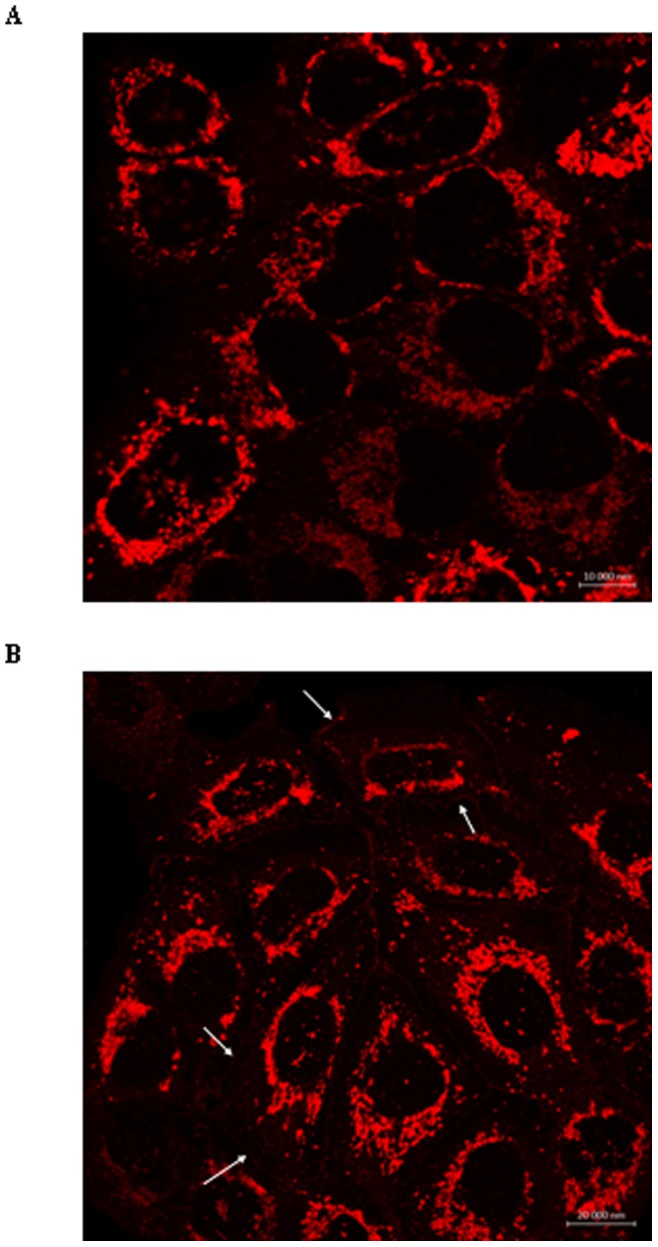
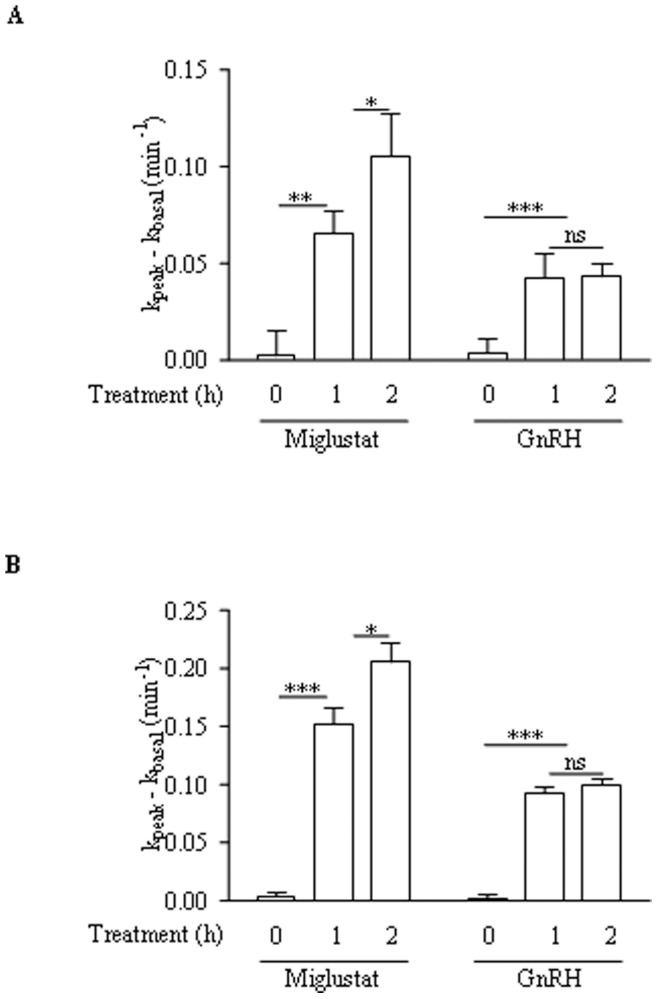
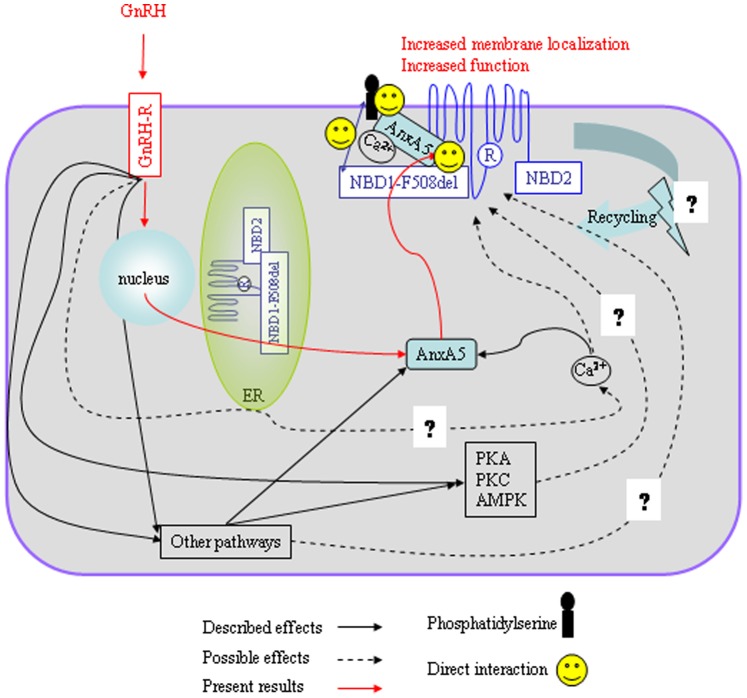
Cystic fibrosis (CF), the most common autosomal recessive disease in Caucasians, is due to mutations in the CFTR gene. F508del, the most frequent mutation in patients, impairs CFTR protein folding and biosynthesis. The F508del-CFTR protein is retained in the endoplasmic reticulum (ER) and its traffic to the plasma membrane is altered. Nevertheless, if it reaches the cell surface, it exhibits a Cl(-) channel function despite a short half-life. Pharmacological treatments may target the F508del-CFTR defect directly by binding to the mutant protein or indirectly by altering cellular proteostasis, and promote its plasma membrane targeting and stability. We previously showed that annexine A5 (AnxA5) directly binds to F508del-CFTR and, when overexpressed, promotes its membrane stability, leading to the restoration of some Cl(-) channel function in cells. Because Gonadotropin-Releasing Hormone (GnRH) increases AnxA5 expression in some cells, we tested it in CF cells. We showed that human epithelial cells express GnRH-receptors (GnRH-R) and that GnRH induces an AnxA5 overexpression and an increased Cl(-) channel function in F508del-CFTR cells, due to an increased stability of the protein in the membranes. Beside the numerous physiological implications of the GnRH-R expression in epithelial cells, we propose that a topical use of GnRH is a potential treatment in CF.


Conflict of interest statement

Competing Interests: The authors have declared that no competing interests exist.

Figures

Figure 1
Figure 1. Basal mRNA and protein expression of GnRH-R.
A. The upper left panel shows representative PCR bands for GnRH-R (319 bp) after separation (2% agarose gel). A single band is observed in 16HBE14o (lane 1), CFBE41o (lane 2), CFBE41o−/corr (lane 3) and CFBE41o−/F508del (lane 4) cells. No signal is observed in the negative control (lane 5). The upper right panel shows positive controls (human pituitary gland and human MCF7cell line, lanes 1 and 2, respectively) for the detection of GnRH-R. cDNAs were from the human pituitary gland and the human MCF7cell line (breast adenocarcinoma), respectively. The mRNA expression of G3PDH (121 bp) is shown lower panel for the same samples. MW is the molecular weight given in base pairs (bp). B. The quantitative analysis (n = 5) of the mRNA of GnRH-R. Ct is the Cycle Threshold. A hight Ct correspond to low mRNA abundance because more PCR cycles are needed to detect it. Endogenous control has a lower Ct than the target mRNA. Therefore, a low ΔCt ( = Ct gene – Ct control) correspond to high mRNA abundance C. Upper panel shows representative immunoblots of GnRH-R (64 kDa) and lower panel shows representative immunoblots of G3PDH (37 kDa). A protein expression is observed in 16HBE14o (lane 1), CFBE41o (lane 2), CFBE41o−/corr (lane 3) and CFBE41o−/F508del (lane 4) cells. A positive control (lane 5) was used for the detection of GnRH-R (human breast duct carcinoma (T-47D) whole cell lysate). G3PDH was used for further normalization. D. The densitometric analysis of GnRH-R expression (n = 6) did not show any difference between cell lines.
Figure 2
Figure 2. Validation of the detection of GnRH-R in immunoblots.
A. Representative immunoblots of GnRH-R detection (upper panel) after 48 h transfection with the Human cDNA clone pCMV6-XL5/GNRH-R in 16HBE14o (1) and CFBE41o (2) cells. pCMV6-XL5 empty plasmid was used as a control. B. The densitometric analysis after normalization by G3PDH expression and comparison with the controls, indicate that the GnRH-R expression in significantly increased, (n = 5). C. Representative immunoblots of GnRH-R detection after 72 h transfection with a siGENOME individual duplex targeting GnRH-R in 16HBE14o (1) and CFBE41o (2) cells. siGENOME Non-Targeting was used as control. A decreased expression of GnRH-R is observed in both cell types. D. The densitometric analysis after normalization by G3PDH expression and comparison with the controls, indicate that the GnRH-R expression is significantly decreased in 16HBE14o (1) and CFBE41o (2) cells (n = 7) in the presence of siRNA.
Figure 3
Figure 3. Basal mRNA and protein expression of AnxA5.
A. The left image shows representative PCR bands for AnxA5 (149 bp) and the right image shows representative PCR bands for G3PDH (121 bp, 2% agarose gel). A single band is observed in 16HBE14o (lane 1), CFBE41o (lane 2), CFBE41o−/corr (lane 3) and CFBE41o−/F508del (lane 4) cells. No signal is observed in the negative control (lane 5). MW is the molecular weight given in base pairs (bp). B. The gene expression of AnxA5 was determined by quantitative Real-Time PCR in each cell line and data were analyzed by using ΔCt (target – reference). Comparison between CFBE41o−/corr (3) and CFBE41o−/F508del (4) cells show a higher expression in CF cells. C. The upper image shows a representative immunodetection of AnxA5 protein (35 kDa) and the lower image shows the immunodetection of G3PDH (37 kDa) protein expression in 16HBE14o (lane 1), CFBE41o (lane 2), CFBE41o−/corr (lane 3) and CFBE41o−/F508del (lane 4) cells. Pure AnxA5 was used as a positive control (lane 5). G3PDH was detected to show that the loading was identical in each lane and for further normalization. D. Statistical analysis of AnxA5 expression (n = 6) indicate that the expression of AnxA5 does not vary among cell lines although it tends to be higher in CFBE41o−/corr and CFBE41o−/F508del cells than in 16HBE14o or CFBE41o cells.
Figure 4
Figure 4. AnxA5 expression when cells are treated for 60 min with GnRH.
A. Representative immunoblots showing AnxA5 and G3PDH expression in 16HBE14o (1), CFBE41o (2), CFBE41o−/corr (3) and CFBE41o−/F508del (4) cells after 60 min of treatment by GnRH (10−9 M). An increased expression is observed in all cell types. B. Densitometric analysis of AnxA5 expression. Data are normalized by G3PDH. AnxA5 protein expression is presented as mean ± S.E.M (7 independent experiments with n ≥2 for each experiment). For each cell line, the statistical analysis was performed by comparing the normalized amount of AnxA5 between cells incubated with buffer alone (white bars adjusted to 1) and cells incubated with GnRH (black bars).
Figure 5
Figure 5. Activation of wild-type and F508del-CFTR chloride channel activity in cells treated by GnRH.
A. Example of mean traces showing the restoration of an iodide efflux in 16HBE14o- cells untreated or treated 1 h with 1 nM GnRH and stimulated by 10 µM forskolin and 30 µM genistein. B. Bar graph showing the enhancement of the chloride channel function of CFTR in 16HBE14o, CFBE41o, CFBE41o−/corr and CFBE41o−/F508del cells (1, 2, 3 and 4, respectively) using iodide efflux experiments. Histograms show the mean relative rate of iodide efflux in each cell type, with and without GnRH treatement. A significant increase is observed in the presence of GnRH (n = 4).
Figure 6
Figure 6. Concentration-dependent effect of GnRH.
Concentration-dependent enhancement of CFTR’s function by GnRH in 16HBE14o (A), CFBE41o (B), CFBE41o−/corr (C) and CFBE41o−/F508del (D): CFTR activity was assessed with the iodide effluxes technique in the presence of forskoline (10 µM) plus genistein (30 µM) after 1h of incubation. Results are expressed as normalized means (± SEM, n = 4).
Figure 7
Figure 7. Activation of CFTR current in CFBE41o−/corr and CFBE41o−/F508del cells by patch –clamp experiments.
A. Upper panel shows I/V curves (normalized by cell capacitance pF, mean±SEM) for CFTR current in CFBE41o−/corr cells in the whole cell configuration. Basal condition is with MgATP in the intracellular buffer. CFTR was activated by forskolin plus genistein and inhibited by CFTR inhibitor 172. Curves obtained with and without GnRH treatment (1 hour) were plotted. The lower panel shows the statistical analysis of the currents noted at +80 mV. B. Same as in A for CFBE41o−/F508del cells.
Figure 8
Figure 8. Membrane expression of CFTR after GnRH treatment.
The presence of CFTR within membranes was detected by biotinylation experiments. A. Representative immunoblots showing the detection of CFTR in biotinylated surface proteins from 16HBE14o cells. CFTR is present in total proteins (left) and in biotinylated surface proteins (right) after GnRH treatment (10−9 M) for 60 min. The arrowheads indicate the fully glycosylated (180 kDa) CFTR. B. Same image as in A. with CFBE41o−/corr cells. C. Histograms of the densitometric analysis of CFTR’s cell surface expression (n = 4) in 16HBE14o (1) and CFBE41o−/corr (2) cells The biotinylated CFTR level is normalized to the biotinylated Na+/K+-ATPase level. Cells incubated with buffer alone are referred as 1 arbitrary unit.
Figure 9
Figure 9. Immunolocalization of CFTR in CFBE41o−/F508del cells after GnRH treatment.
A. Representative confocal photomicrographs of the localization of F508del-CFTR in cells without any treatment. CFTR is likely observed around the nuclei, in the endpoplasmic reticulum. B. Representative confocal photomicrographs of the localization of F508del-CFTR in cells after GnRH treatment. CFTR is likely observed in the endpoplasmic reticulum but also in membranes.
Figure 10
Figure 10. Comparison of the effect of miglustat and GnRH.
Comparison of the time-dependent effect of GnRH or miglustat upon F508del-CFTR function in CFBE41o- cells (A) and in CFBE41o−/F508del cells (B). CFTR activity was assessed with the iodide effluxes technique in the presence of forskolin (10 µM) plus genistein (30 µM) after 1 nM GnRH or 100 µM miglustat incubation (n = 4).
Figure 11
Figure 11. Schematic representation of the GnRH’s effect on F508del-CFTR function.
We found that F508del-CFTR’s membrane localization and function are increased under GnRH treatment, associated with an increased expression of AnxA5 (red lines). Nevertheless, according to previous results, AnxA5 over expression is likely not the solely event triggered in cells by GnRH. Described events are summarized in black lines and their possible involvement upon F508del-CFTR activity are shown in dotted black lines.

Similar articles

Cited by

References

    1. Riordan JR, Rommens JM, Kerem B, Alon N, Rozmahel R, et al. (1989) Identification of the cystic fibrosis gene: cloning and characterization of complementary DNA. Science 245: 1066–1073. - PubMed
    1. Bear CE, Li CH, Kartner N, Bridges RJ, Jensen TJ, et al. (1992) Purification and functional reconstitution of the cystic fibrosis transmembrane conductance regulator (CFTR). Cell 68: 809–818. - PubMed
    1. Amaral MD (2004) Cftr and chaperones: Processing and degradation. J MolNeurosci 23: 41–48. - PubMed
    1. Cheng SH, Gregory RJ, Marshall J, Paul S, Souza DW, et al. (1990) Defective intracellular transport and processing of cftr is the molecular basis of most cystic fibrosis. Cell 63: 827–834. - PubMed
    1. Lukacs GL, Mohamed A, Kartner N, Chang XB, Riordan JR, et al. (1994) Conformational maturation of cftr but not its mutant counterpart (delta f508) occurs in the endoplasmic reticulum and requires atp. EMBO J 13: 6076–6086. - PMC - PubMed

Publication types

MeSH terms