OpenStage: a low-cost motorized microscope stage with sub-micron positioning accuracy
- PMID: 24586468
- PMCID: PMC3935852
- DOI: 10.1371/journal.pone.0088977
OpenStage: a low-cost motorized microscope stage with sub-micron positioning accuracy
Abstract
Recent progress in intracellular calcium sensors and other fluorophores has promoted the widespread adoption of functional optical imaging in the life sciences. Home-built multiphoton microscopes are easy to build, highly customizable, and cost effective. For many imaging applications a 3-axis motorized stage is critical, but commercially available motorization hardware (motorized translators, controller boxes, etc) are often very expensive. Furthermore, the firmware on commercial motor controllers cannot easily be altered and is not usually designed with a microscope stage in mind. Here we describe an open-source motorization solution that is simple to construct, yet far cheaper and more customizable than commercial offerings. The cost of the controller and motorization hardware are under $1000. Hardware costs are kept low by replacing linear actuators with high quality stepper motors. Electronics are assembled from commonly available hobby components, which are easy to work with. Here we describe assembly of the system and quantify the positioning accuracy of all three axes. We obtain positioning repeatability of the order of 1 μm in X/Y and 0.1 μm in Z. A hand-held control-pad allows the user to direct stage motion precisely over a wide range of speeds (10(-1) to 10(2) μm·s(-1)), rapidly store and return to different locations, and execute "jumps" of a fixed size. In addition, the system can be controlled from a PC serial port. Our "OpenStage" controller is sufficiently flexible that it could be used to drive other devices, such as micro-manipulators, with minimal modifications.
Conflict of interest statement
Figures


 to
to  apart. The points show the final position of the stage and the grey lines link these points, indicating the path taken by stage. At each of the three points (labeled B, C, and D in reference to the sub-plots with which they are associated) there are 50 data points, which at this scale can not be resolved. B-D. The positioning errors at each pollen grain. The colors indicate cycle number, with black being the first observation and white the 50th observation. The distribution of the colors indicates that the positioning errors are not random, and the stage drifts about
  over these 50 positioning cycles. E. Close-up image of the pollen grain at position C. This image is obtained by averaging the raw frames and so it is slightly blurred due to the positioning errors. F. Same as E, but frames were aligned before averaging and so slightly more detail is visible.
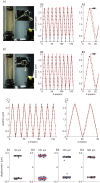
 steps. C. Measured position of the Z-stage as a function of commanded position as the stepper motor is advanced in full steps (0.9°, which should result in motions of
  ). The slope of the regression line (red) is almost 1.0 (dashed line), indicating that the stage moves close to the commanded values. D1. Smooth motion of the bar over time under the control of the DualShock gamepad's analog input stick. Each row corresponds to a different frame. D2. Displacement of the objective as a function of time. Linear regression in red. D3. Residuals of regression from D2. The small periodic errors are due to non-linearities across the stepper motor's micro-stepping cycle.
 . Three cycles of motion are shown. Each point represents data from a single frame. Grey points indicate frames when the Z-stage is moving. Colored points indicate frames when the Z-stage is stationary. Points at the same depth share the same color. Upward motion is indicated by more negative numbers. Positioning accuracy is unidirectional, since the objective always approaches each depth from the same direction. B. The location of the objective over 100 Z-stack cycles. Each point represents objective position from one cycle of one depth. There are 100 points for each depth. Motions are highly repeatable over time. Colored lines are linear regression fits. C. Correspondence between target and achieved position. D. Achieved position for the
  Z-depth. Note the data are bimodally distributed. E. Same data as D, but plotted as a function of stimulus repeat. Different symbols distinguish between data obtained in the first and second blocks (10 minute gap between blocks). F. Same as D, but for the
  depth.
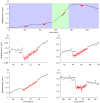
 then returned to the initial position. Blue background indicates time periods over which the room air conditioning is active. Green background indicates time period over which the air conditioning is deactivated, and the room warms. Upward motion is indicated by more negative numbers so, as expected, the objective rises when the room warms. Most of the gradual drift in objective position seems to be due to factors not directly related to motion of the drive system. B–E. Detail showing the motion epochs. Red indicates period during which objective motions are being executed. In three cases (arrowed) the objective undershoots on its return by about 0.05 to
  but rate of drift does not alter during the motion epoch. Thus, these larger amplitude motions are conducted with an accuracy similar to that of the
  Z-stack motions (Fig. 8).
 to
to  ). Each panel shows the return position of the focuser. Data are divided according to the direction from which the focuser approached zero. Each data point is a different return cycle. The bars show mean (red line), 95% confidence interval for the mean (pink area), and 1 standard deviation (blue area). All points being at zero would indicate perfect performance.
References
-
- Denk W, Strickler J, Webb W (1990) Two-photon laser scanning fluorescence microscopy. Science 248: 73–6. - PubMed
-
- Denk W, Svoboda K (1997) Photon Upmanship: Why Multiphoton Imaging Is More than a Gimmick. Neuron 18: 351–357. - PubMed
-
- Denk W, Yuste R, Svoboda K, Tank D (1996) Imaging calcium dynamics in dendritic spines. Cur Op Neurobiol 6: 372–378. - PubMed
-
- Svoboda K, Denk W, Kleinfeld D, Tank D (1996) In vivo dendritic calcium dynamics in neocortical pyramidal neurons. Nature 385: 161–165. - PubMed
-
- Tsai P, Friedman B, Ifarraguerri A, Thompson B, Lev-Ram V, et al. (2003) All-optical histology using ultrashort laser pulses. Neuron 39: 27–41. - PubMed
Publication types
MeSH terms
Grants and funding
LinkOut - more resources
Full Text Sources
Other Literature Sources

