. 2014 Feb 20;9(2):e89010.
doi: 10.1371/journal.pone.0089010. eCollection 2014.

Inflammation enhances IL-2 driven differentiation of cytolytic CD4 T cells

Affiliations

Inflammation enhances IL-2 driven differentiation of cytolytic CD4 T cells

Aspen M Workman et al. PLoS One. .

Abstract

Cytolytic CD4 T cells (CD4 CTL) have been identified in vivo in response to viral infections; however, the factors necessary for driving the cytolytic phenotype have not been fully elucidated. Our previously published work suggests IL-2 may be the master regulator of perforin-mediated cytotoxicity in CD4 effectors. To further dissect the role of IL-2 in CD4 CTL generation, T cell receptor transgenic mice deficient in the ability to produce IL-2 or the high affinity IL-2 receptor (IL-2Rα, CD25) were used. Increasing concentrations of IL-2 were necessary to drive perforin (Prf) expression and maximal cytotoxicity. Granzyme B (GrB) expression and killing correlated with STAT5 activation and CD25 expression in vitro, suggesting that signaling through the high affinity IL-2R is critical for full cytotoxicity. IL-2 signaling was also necessary in vivo for inducing the Th1 phenotype and IFN-γ expression in CD4 T cells during influenza A (IAV) infection. In addition, GrB expression, as measured by mean fluorescent intensity, was decreased in CD25 deficient cells; however, the frequency of CD4 cells expressing GrB was unchanged. Similarly, analysis of cytolytic markers such as CD107a/b and Eomesodermin indicate high IL-2Rα expression is not necessary to drive the CD4 CTL phenotype during IAV infection. Thus, inflammatory signals induced by viral infection may overcome the need for strong IL-2 signals in driving cytotoxicity in CD4 cells.


Conflict of interest statement

Competing Interests: The authors declare that no competing interests exist.

Figures

Figure 1
Figure 1. IL-2 regulates perforin expression and cytotoxicity in a dose dependent manner in vitro.
CD4 effectors were generated from naive DO11.10/IL-2−/− Ova specific TCR tg CD4 cells as described in the Materials and Methods using peptide pulsed APC and increasing doses of IL-2. Four days later, cells were collected and stained for CD4, KJ126 (Ova specific TCR), CD25 and intracellular levels of GrB (A). The histograms show levels of GrB and CD25 expression on gated CD4+/KJ126+ effectors generated with increasing doses of IL-2. B) The percent of maximum GrB expression was calculated by dividing the GrB MFI in CD4 cells incubated with 1, 5 or 100 ng/ml IL-2 by the GrB MFI in CD4 cells incubated with 10 ng/ml as the control. Shown is the average +/− SD of 3–4 separate experiments. C) Freshly isolated naive TCR tg CD4 cells, or CD4 effectors grown in the presence of increasing IL-2 concentration were resuspended in lysis buffer as described. Cell lysate was run on a 7.5% polyacrylamide gel, transferred to membrane and perforin protein detected with mouse anti-perforin antibody. A 66 kD band is shown for perforin (top panel) and β-actin (bottom panel) is shown as a loading control. D) CD4 effectors were analyzed for their ability to lyse target cells by co-incubation with Ova peptide pulsed A20 cells for 4 h at a 3∶1 E:T ratio. Target cells were then stained with antibody to Annexin V as a marker of target cell killing. Percent Annexin V positive cells in each group was determined after gating on CD4-negative A20 cells in the presence (open histograms) or absence (shaded histograms) of Ova peptide. Representative histograms are shown with numbers indicating percent Annexin V+ A20 cells pulsed with peptide after gating based on negative control (unpulsed A20 cells). Panel (E) shows the average +/− SD of percent Annexin V positive cells at each dose of IL-2 from 3–4 independent experiments.
Figure 2
Figure 2. Sustained STAT5 phosphorylation correlates with GrB expression and cytotoxicity.
CD4 effectors were cultured with Ova pulsed APCs, 10/ml IL-2, 10 ng/ml IL-7 or 25 ng/ml IL-15. At various time points, cells were collected and stained with antibodies to CD4, KJ126 and anti-phospho STAT5. Representative histograms showing the amount of phosphorylated STAT5 after gating on CD4/KJ126+ cells at 2 and 24 h is shown (A). Panel B is the average +/− SEM of 3–4 separate experiments of % STATp over time. CD4 effectors grown in IL-2, IL-7 and IL-15 for 4 days were collected and analyzed for GrB expression by flow cytometry (C) or killing activity by the JAM assay. This experiment was repeated 4 times and panel D is the average +/− SD of lytic units on the left axis compared to MFI of GrB expression on the right axis demonstrating a high correlation between GrB expression and killing activity.
Figure 3
Figure 3. Inhibitors of the Jak3/STAT5 pathway block GrB expression and cytotoxicity.
Naive CD4 DO11.10/IL-2−/− TCR tg cells were incubated with peptide pulsed APC, 10 ng/ml IL-2 and various concentrations of chemical inhibitors that block phosphorylation of Jak3 or dimerization of STAT5a and STAT5b. Four days later, CD4 effectors were analyzed for GrB expression by flow cytometry after gating on CD4+/KJ126+ cells (A). Panel B shows the percent of maximum GrB MFI in CD4 effectors treated with concentrations of inhibitors shown in panel A. Effectors incubated with DMSO are shown as a diluent control for inhibitors. Shown is the average +/− SD for 3 separate experiments. Jak3i at 400 nM and STAT5i at 50 µM show statistically significant decreases in GrB MFI († p = .0006, *p = .0005). In C and D, CD4 effectors were generated as described from naive CD4 TCR tg cells from 3 separate mice and 4 days later, co-incubated with peptide pulsed targets in a 4 h killing assay. Panel C shows representative histograms of CD4 effectors incubated with IL-2 or IL-2 and Jak3i at 400 nM and Panel D is the average +/− SD of 3 individual effector preparations per group. Cytotoxicity by CD4 effectors treated with Jak3i is statistically lower than cytotoxicity by CD4 effectors generated with IL-2 alone (*p = 0.0014).
Figure 4
Figure 4. Expression of the high affinity IL-2R (CD25) is necessary for optimal CTL activity.
Naive CD4 cells from DO11.10 (WT), DO11.10/CD25+/− and DO11.10/CD25−/− mice were cultured with Ova pulsed APC and IL-2 as described. Four days later, cells were collected and stained for CD4/KJ126, CD25 (A) and intracellular levels of GrB (B). Representative histograms are shown in Panel A and B. In C) 4 day WT, CD25+/− and CD25−/− effectors were collected and co-incubated with peptide coated A20 cells in a 4 h killing assay. Shown are representative histograms of percent Annexin V positive cells of peptide pulsed A20, using unpulsed A20 as a negative control to set histogram gates. Panel D is the average +/− SD of GrB intensity in different effector populations compared to Annexin V+ target cell killing for each effector population over 4 independent experiments. In each experiment, GrB MFI and Annexin V+ cells incubated with WT was used as 100% maximum value. E) Lysates of effectors generated with 10 or 100 ng/ml IL-2 were run on SDS-PAGE gel as described and incubated with antibody to perforin. Levels of β-actin are shown as a loading control.
Figure 5
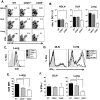
Figure 5. High affinity IL-2R is required for optimal GrB expression and IFN-
γ secretion in response to influenza infection. Ova specific cells were transferred i. v. to BALB/c mice followed by infection with 5000 EID50 PR8/Ova. Seven dpi, mice were sacrificed, NDLN, DLN and lungs isolated and stained with antibodies to CD4 and Ova specific TCR (KJ126). A) Shown are representative FACS plots and percentage of Ova specific CD4 cells in NDLN (top) DLN (middle) and lung (bottom) samples. B) Total number of Ova specific CD4 cells were also calculated for each organ based on percentages from (A) and total cell numbers (p = .0002). Total lung cells were stained with CD4, KJ126 and intracellular stained for GrB directly ex vivo. Panel C shows a representative overlay histogram after gating on CD4+/KJ126+ cells and panel E shows the mean fluorescent intensity (MFI) of GrB expression for all mice. Total cells in the DLN and lung were restimulated with Ova323-339 peptide followed by intracellular staining for IFN-γ (D and F). D) Shown are representative overlay histograms of % IFN-γ cells in the DLN (left panel) or lung (right panel) after gating on CD4+/KJ126+ cells. Panel F shows the percent IFN-γ positive cells in the DLN (left panel) or lung (right panel) of 5 individual mice per group. The bar represents the average of all 5 mice per group. *p is <0.05 by student’s t test. denotes p<.002 by student’s t test.
Figure 6
Figure 6. High IL-2R expression is required for GrB and Th1 functions, but not for cytolytic activity.
Ova specific cells were transferred i. v. to BALB/c mice followed by infection with 1000 EID50 PR8/Ova. Seven dpi, mice were sacrificed, lungs isolated and stained with antibodies to CD4 and KJ126, followed by staining with NKG2A/C/E and intracellular GrB, or intracellular Tbet and Eomes. A) Shown are representative FACS plots and percentage of WT Ova specific CD4 cells (top) or CD25+/− Ova specific CD4 cells (bottom). Also shown are representative 2 parameter histograms for NKG2ACE and GrB after gating on CD4+/KJ126+ cells. B) Representative overlay histograms of Tbet (top) and Eomes (bottom) after gating on Ova specific cells. The solid line represents expression in WT cells while the shaded histogram is expression in CD25+/− cells. C) Lung cells were also restimulated with Ova peptide or media alone for 4h in vitro followed by staining for CD4, KJ126, CD107a/b and IFN-γ. Shown are 2 parameter histograms for CD107a and IFN-γ after gating on WT Ova specific cells (top) or CD25+/− Ova specific cells (bottom) with or without (media) Ova peptide. The absolute number of Ova specific cells in lungs (D) is shown. GrB MFI (E), percent Tbet+ (F) and percent IFN-γ+ (G) after gating on Ova specific cells are shown. Percent NKG2A/C/E and GrB double positive cells (H), percent Eomes+ (I), percent CD107a/b+ cells (J) and CD107a/b MFI (K) are shown after gating on Ova specific cells. The † represents statistically significant differences where p<0.004 by student’s t-test.

Similar articles

Cited by

References

    1. Zhu J, Yamane H, Paul WE (2010) Differentiation of effector CD4 T cell populations (*). Annu Rev Immunol 28: 445–489. - PMC - PubMed
    1. Zhu J, Paul WE (2008) CD4 T cells: fates, functions, and faults. Blood 112: 1557–1569. - PMC - PubMed
    1. Billings P, Burakoff S, Dorf ME, Benacerraf B (1977) Cytotoxic T lymphocytes specific for I region determinants do not require interactions with H-2K or D gene products. J Exp Med 145: 1387–1392. - PMC - PubMed
    1. Jacobson S, Richert JR, Biddison WE, Satinsky A, Hartzman RJ, et al. (1984) Measles virus-specific T4+ human cytotoxic T cell clones are restricted by class II HLA antigens. J Immunol 133: 754–757. - PubMed
    1. Lukacher AE, Morrison LA, Braciale VL, Malissen B, Braciale TJ (1985) Expression of specific cytolytic activity by H-2I region-restricted, influenza virus-specific T lymphocyte clones. J Exp Med 162: 171–187. - PMC - PubMed

Publication types

MeSH terms