. 2014 Feb 19;9(2):e89073.
doi: 10.1371/journal.pone.0089073. eCollection 2014.

Fast, multi-dimensional and simultaneous kymograph-like particle dynamics (SkyPad) analysis

Affiliations

Fast, multi-dimensional and simultaneous kymograph-like particle dynamics (SkyPad) analysis

Bruno Cadot et al. PLoS One. .

Abstract

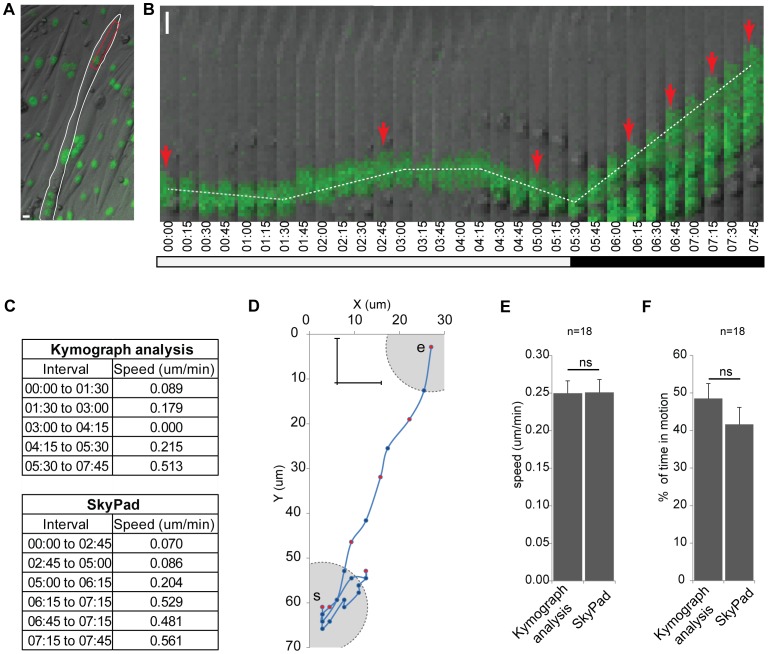
Background: Kymograph analysis is a method widely used by researchers to analyze particle dynamics in one dimensional (1D) trajectories.

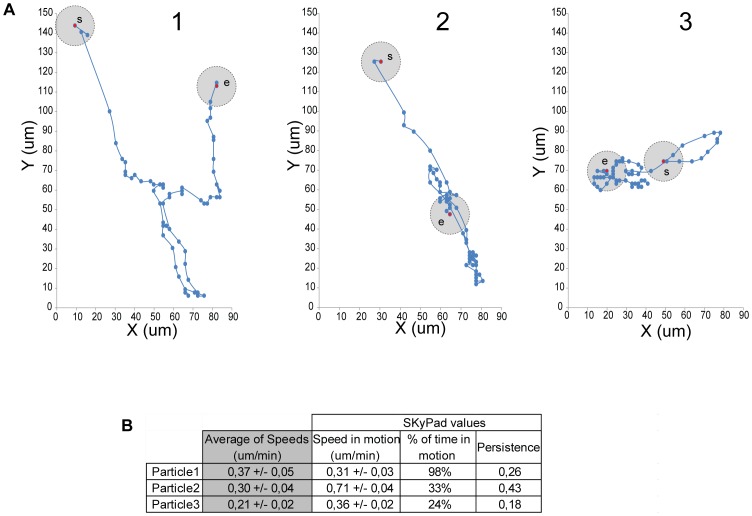
Results: Here we provide a Visual Basic-coded algorithm to use as a Microsoft Excel add-in that automatically analyzes particles in 2D trajectories with all the advantages of kymograph analysis.

Conclusions: This add-in, which we named SkyPad, leads to significant time saving and higher accuracy of particle analysis. Finally, SkyPad can also be used for 3D trajectories analysis.


Conflict of interest statement

Competing Interests: The authors have declared that no competing interests exist.

Figures

Figure 1
Figure 1. Comparison between kymograph analysis and SkyPad.
A: First frame of a movie showing a myotube (white outline) with GFP-H1 nuclei (green). The red rectangle corresponds to the region used to create the kymograph in panel b. B: Kymograph showing nuclei moving in a myotube. Red arrows indicate the position where the nucleus moved at least 10 um from the previous arrow as calculated through SkyPad. White bar indicates a pausing or oscillating period, black bar indicates a moving period. Time in HH:min C: Speeds obtained by kymograph analysis and SkyPad between indicated frames. D: Trajectory of the nucleus represented with the coordinates in X and Y at each time point. The cross and gray circle represent the 10 um distance threshold used in SkyPad. The circle is traced on the first and last point of the trajectory (s and e respectively). Red dots correspond to arrow pointed positions in panel b. E, F: Speeds (e) and percentage of time in motion (f) of 18 nuclei were analyzed using kymograph and skypad analysis. Error bars correspond to S.E.M. Scale bars in a and b: 10 um.
Figure 2
Figure 2. SkyPad analysis identifies multiple particles dynamics phenotypes.
A: XY coordinates plots of 3 different particles. The gray circle on each plot represents the distance threshold used in the algorithm (10 um radius) and is showed on the first and last point of the trajectory. B: Table with the results obtained by averaging instantaneous speeds (gray column) and the results obtained by SkyPad (white columns) for the three particles described in a.

References

    1. Jaqaman K, Loerke D, Mettlen M, Kuwata H, Grinstein S, et al. (2008) Robust single-particle tracking in live-cell time-lapse sequences. Nat Meth 5: 695–702. - PMC - PubMed
    1. Racine V, Sachse M, Salamero J, Fraisier V, Trubuil A, et al. (2007) Visualization and quantification of vesicle trafficking on a three-dimensional cytoskeleton network in living cells. Journal of Microscopy 225: 214–228. - PubMed
    1. Karle KN, Möckel D, Reid E, Schöls L (2012) Axonal transport deficit in a KIF5A(−/−) mouse model. Neurogenetics 13: 169–179. - PMC - PubMed
    1. Park JJ, Loh YP (2011) Visualization of Peptide Secretory Vesicles in Living Nerve Cells. In Merighi A (ed.), Neuropeptides pp 137–145. Humana Press, Totowa, NJ. - PMC - PubMed
    1. Wang X, Schwarz TL (2009) The Mechanism of Ca2+-Dependent Regulation of Kinesin-Mediated Mitochondrial Motility. Cell 136: 163–174. - PMC - PubMed

Publication types