. 2014 Feb 21;9(2):e89113.
doi: 10.1371/journal.pone.0089113. eCollection 2014.

A compartmentalized mathematical model of the β1-adrenergic signaling system in mouse ventricular myocytes

Affiliations

A compartmentalized mathematical model of the β1-adrenergic signaling system in mouse ventricular myocytes

Vladimir E Bondarenko. PLoS One. .

Abstract

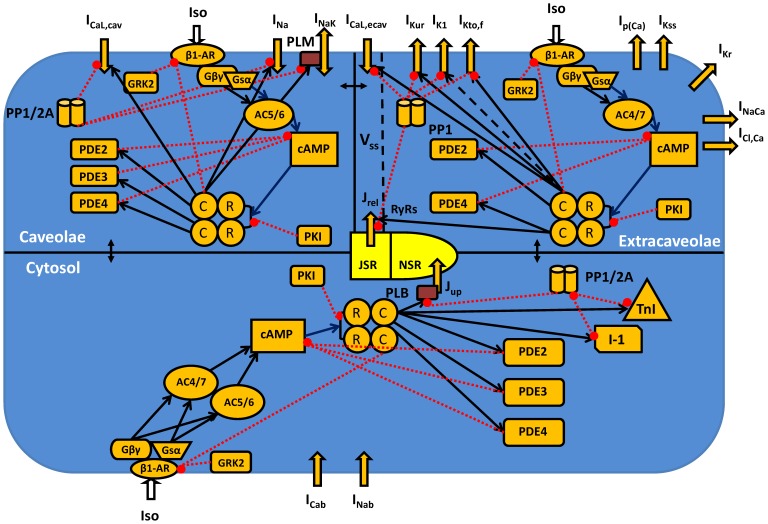
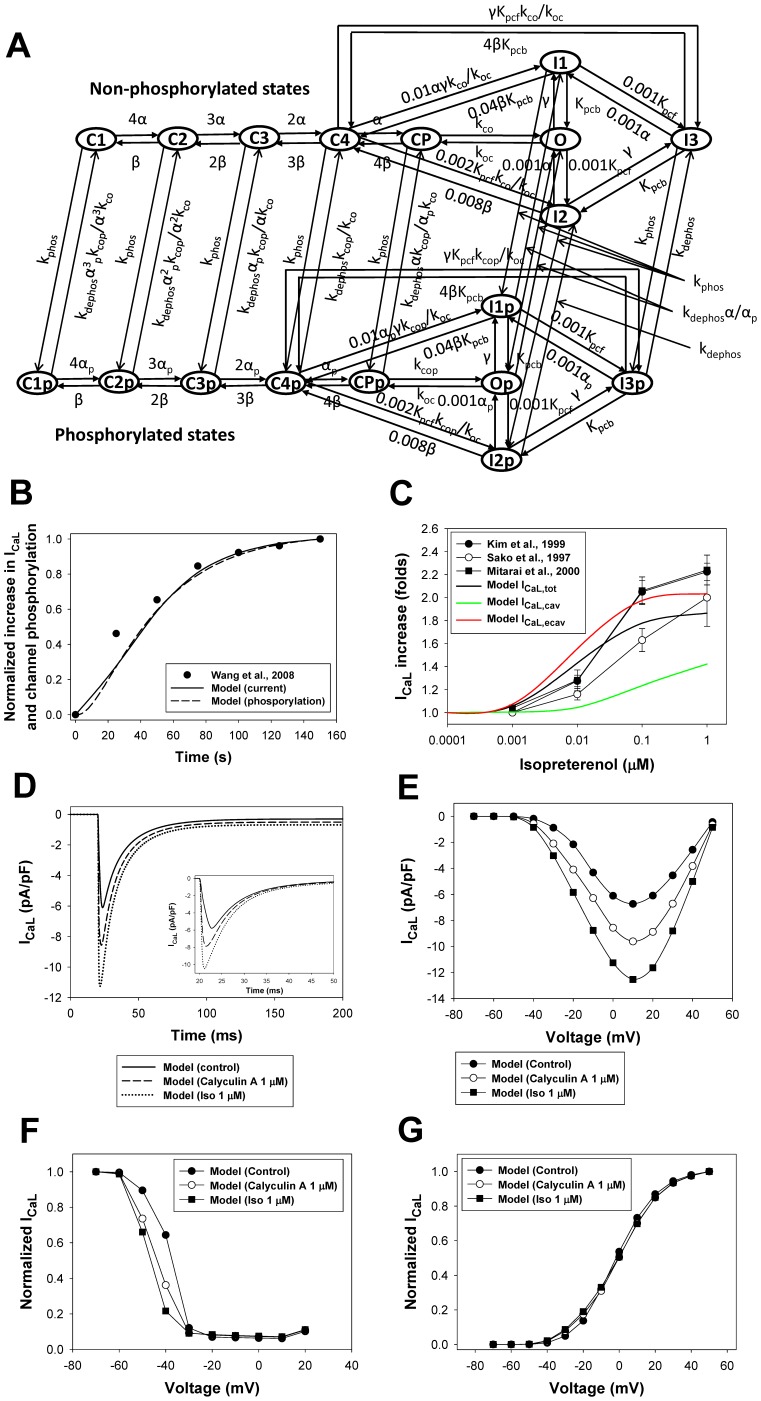
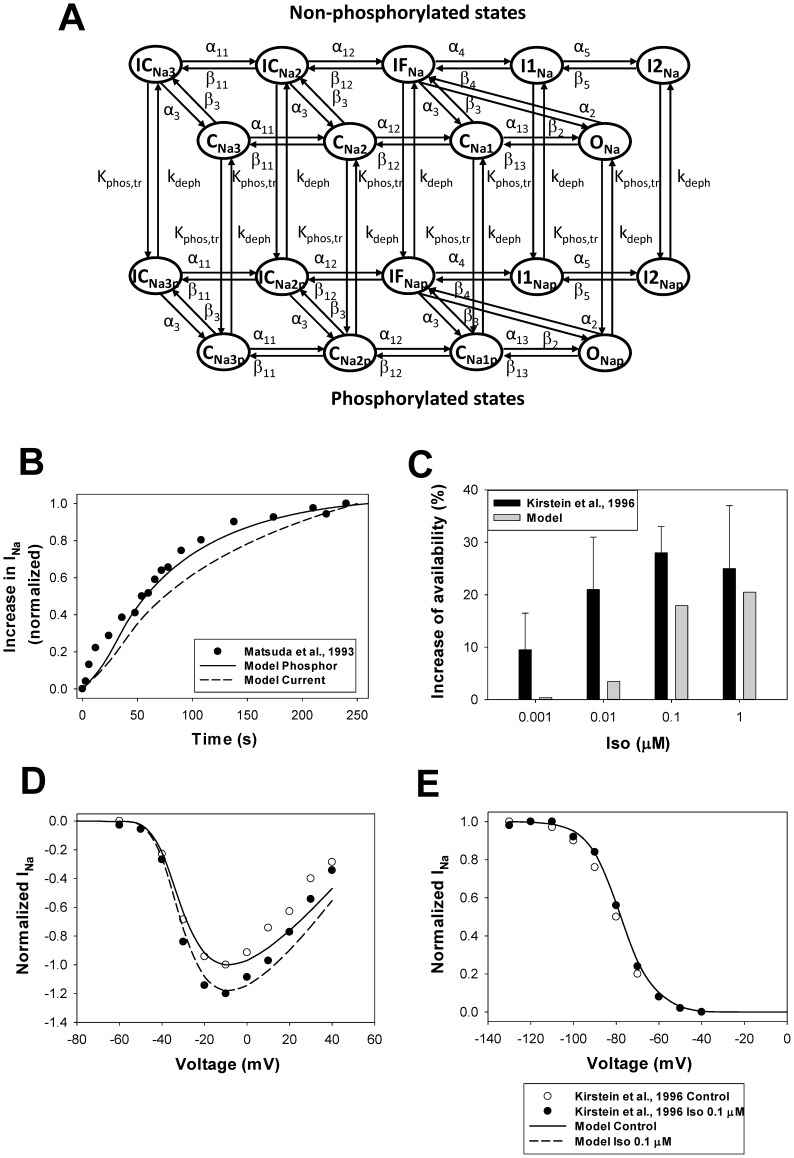
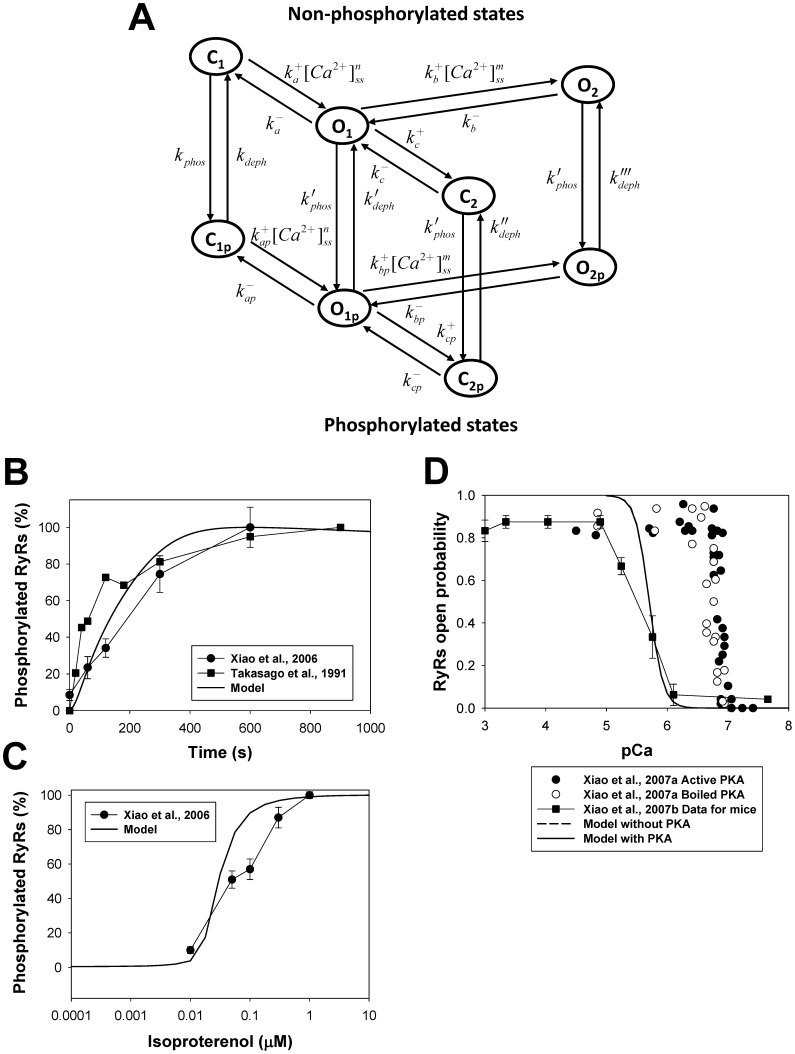
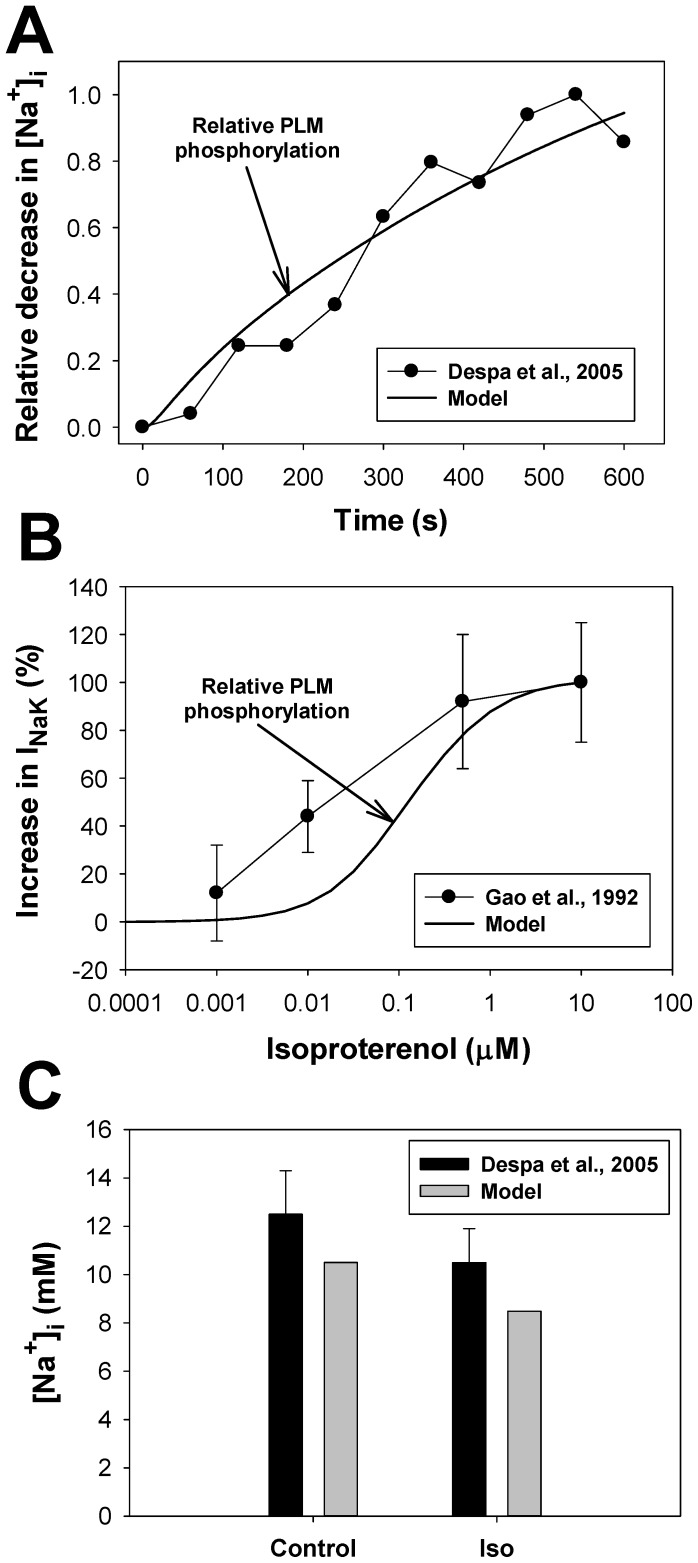
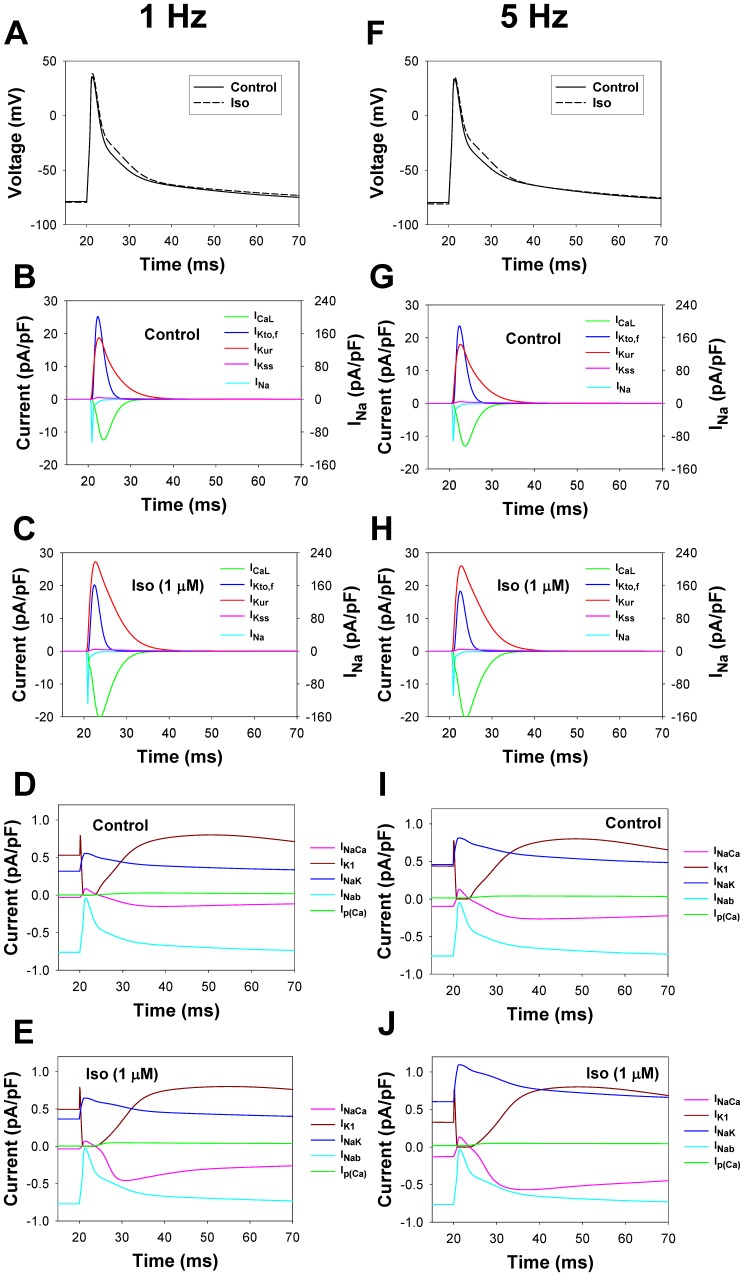
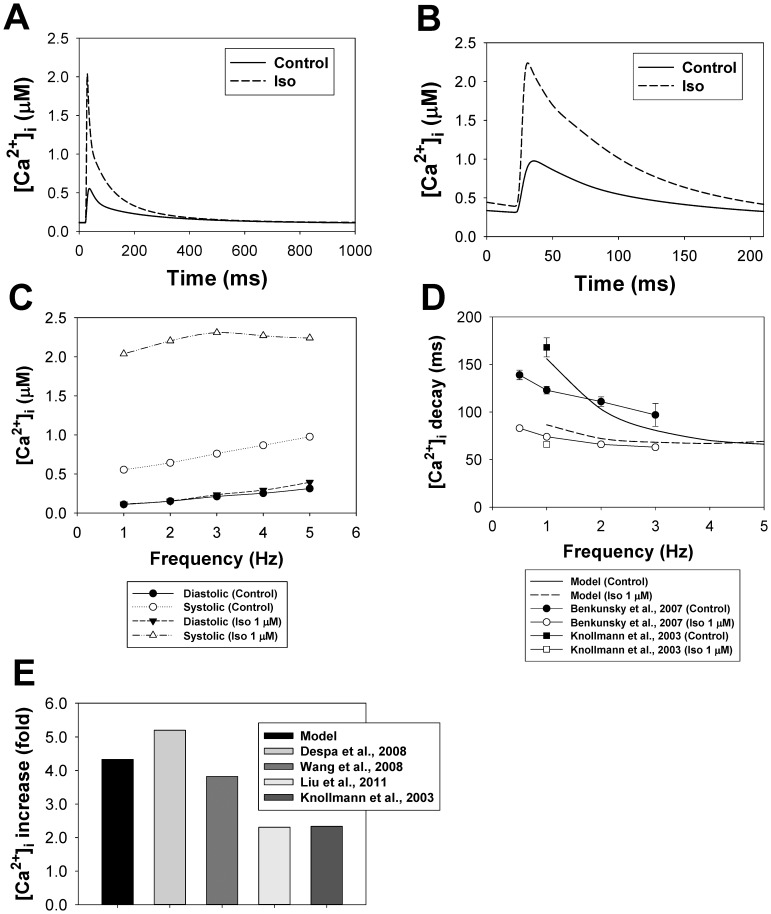
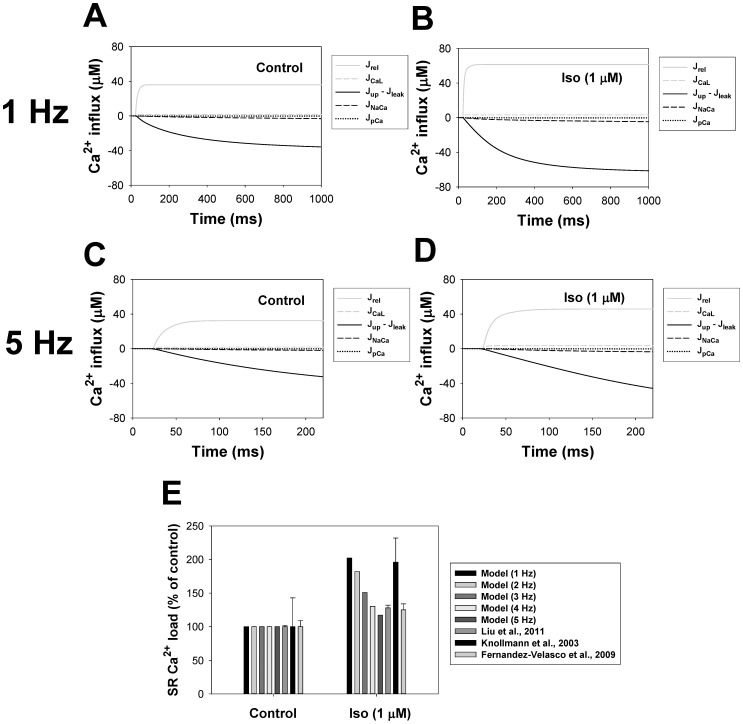
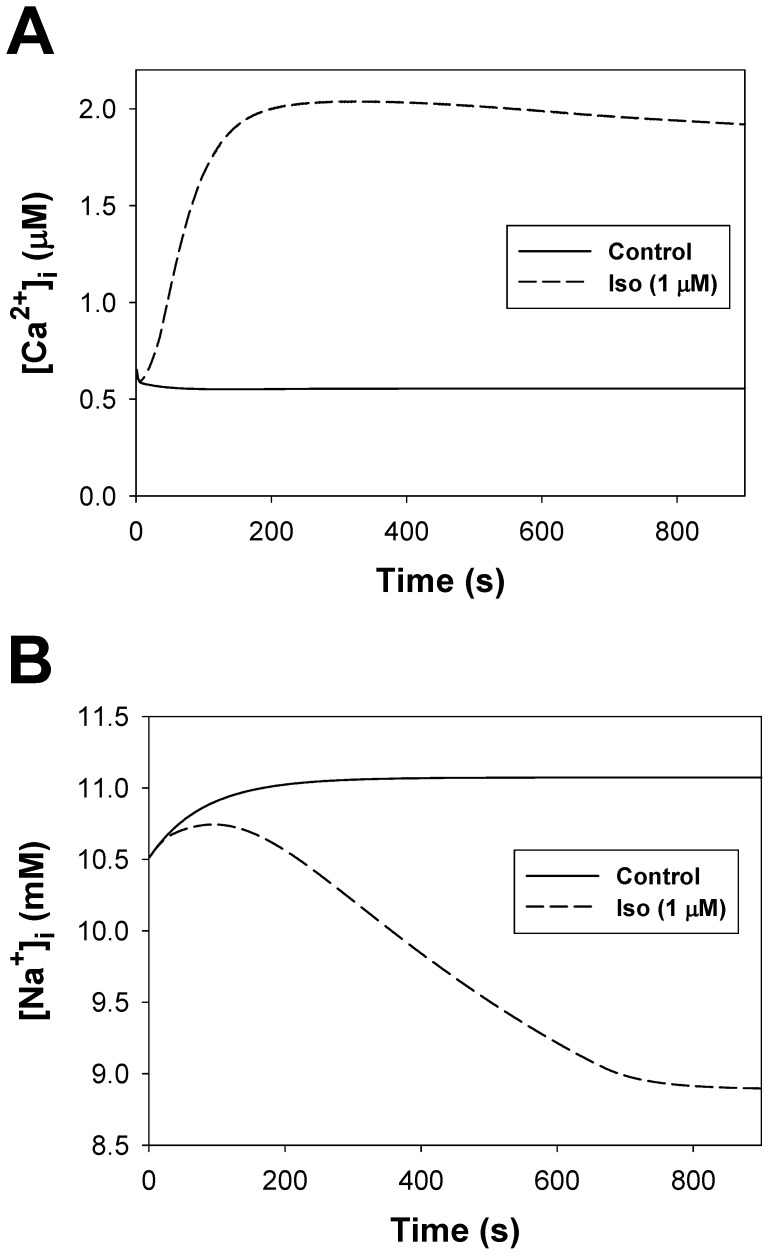
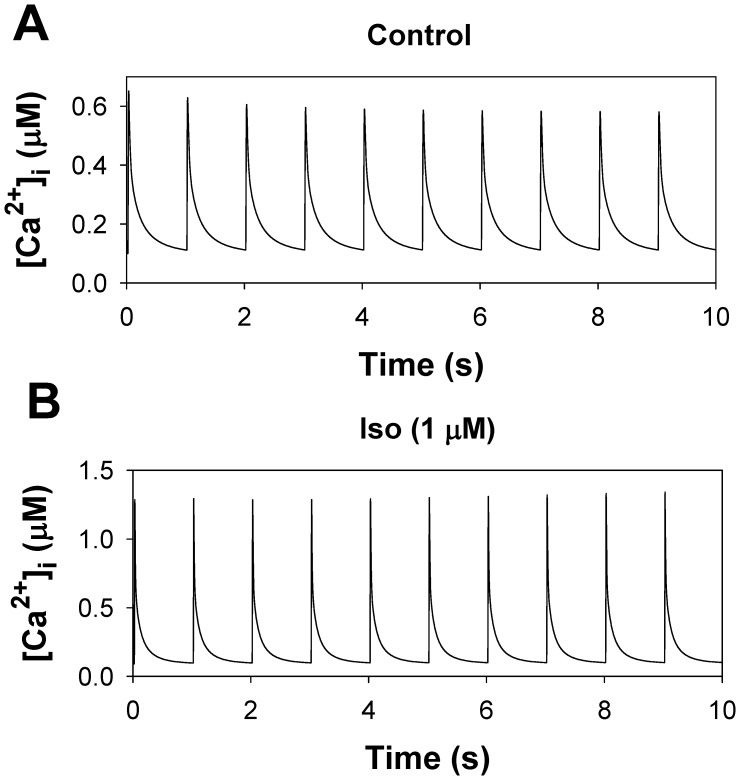
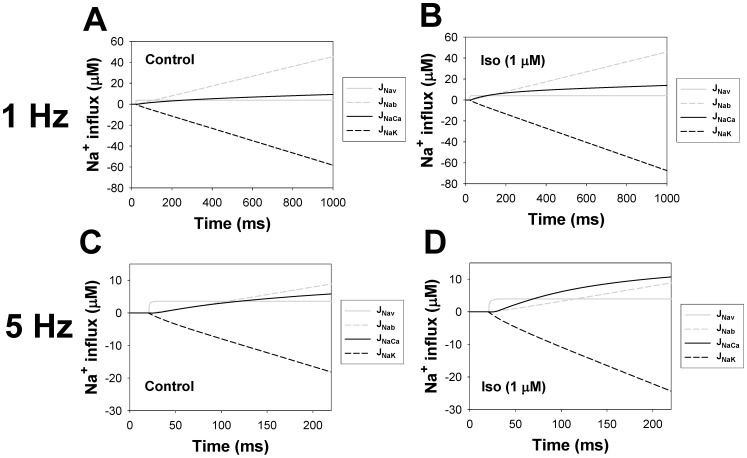
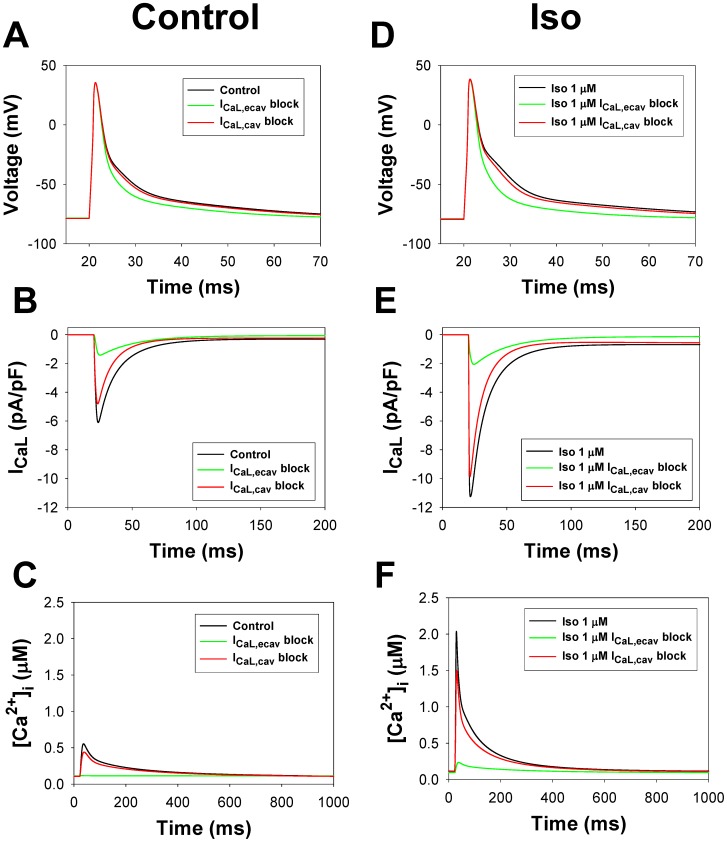
The β1-adrenergic signaling system plays an important role in the functioning of cardiac cells. Experimental data shows that the activation of this system produces inotropy, lusitropy, and chronotropy in the heart, such as increased magnitude and relaxation rates of [Ca(2+)]i transients and contraction force, and increased heart rhythm. However, excessive stimulation of β1-adrenergic receptors leads to heart dysfunction and heart failure. In this paper, a comprehensive, experimentally based mathematical model of the β1-adrenergic signaling system for mouse ventricular myocytes is developed, which includes major subcellular functional compartments (caveolae, extracaveolae, and cytosol). The model describes biochemical reactions that occur during stimulation of β1-adrenoceptors, changes in ionic currents, and modifications of Ca(2+) handling system. Simulations describe the dynamics of major signaling molecules, such as cyclic AMP and protein kinase A, in different subcellular compartments; the effects of inhibition of phosphodiesterases on cAMP production; kinetics and magnitudes of phosphorylation of ion channels, transporters, and Ca(2+) handling proteins; modifications of action potential shape and duration; magnitudes and relaxation rates of [Ca(2+)]i transients; changes in intracellular and transmembrane Ca(2+) fluxes; and [Na(+)]i fluxes and dynamics. The model elucidates complex interactions of ionic currents upon activation of β1-adrenoceptors at different stimulation frequencies, which ultimately lead to a relatively modest increase in action potential duration and significant increase in [Ca(2+)]i transients. In particular, the model includes two subpopulations of the L-type Ca(2+) channels, in caveolae and extracaveolae compartments, and their effects on the action potential and [Ca(2+)]i transients are investigated. The presented model can be used by researchers for the interpretation of experimental data and for the developments of mathematical models for other species or for pathological conditions.


Conflict of interest statement

Competing Interests: Vladimir Bondarenko is an Academic Editor of PLOS ONE. This does not alter his adherence to all the PLOS ONE policies on sharing data and materials.

Figures

Figure 1
Figure 1. Schematic representation of the β1-adrenergic signaling system in mouse ventricular myocytes.
Transmembrane currents are the fast Na+ current (INa), the two components of the L-type Ca2+ current in caveolae and extracaveolae compartments (ICaL,cav and ICaL,ecav, respectively), the sarcolemmal Ca2+ pump (Ip(Ca)), the Na+/Ca2+ exchanger (INaCa), the rapidly recovering transient outward K+ current (IKto,f), the rapid delayed rectifier K+ current (IKr), the ultrarapidly activating delayed rectifier K+ current (IKur), the noninactivating steady-state voltage activated K+ current (IKss), the time-independent K+ current (IK1), the Na+/K+ pump (INaK, is regulated by phospholemman, PLM), the Ca2+ and Na+ background currents (ICab and INab). The Ca2+ fluxes are uptake of Ca2+ from the cytosol to the network sarcoplasmic reticulum (NSR) (Jup) by the SERCA pump and Ca2+ release from the junctional sarcoplasmic reticulum (JSR) (Jrel) through the ryanodine receptors (RyRs). There are three intracellular compartments in the β1-adrenergic signaling system: caveolae, extracaveolae, and cytosol. The subspace volume (Vss) is located in the extracaveolae domain. Components of the β1-adrenergic signaling system are the β1-adrenergic receptors (β1-AR), the α-subunit of stimulatory G-protein (G), the βγ-subunit of stimulatory G-protein (Gβγ), the adenylyl cyclases of type 5/6 or 4/7 (AC5/6 or AC4/7, respectively), the phosphodiesterases of type 2, 3, or 4 (PDE2, PDE3, or PDE4, respectively), the cyclic AMP (cAMP), regulatory (R) and catalytic (C) subunits of protein kinase A holoenzyme, the protein kinase A inhibitor (PKI), the G-protein-coupled receptor kinase of type 2 (GRK2), the protein phosphatases of type 1 or 2A (PP1 or PP2A, respectively), the inhibitor-1 (I-1). The cytosolic proteins which are the substrates of the β1-adrenergic signaling system are the phospholamban (PLB) and troponin I (TnI). Stimulatory links are shown by black arrows and inhibitory links are shown by red dashed lines with balls. [Ca2+]i, [Na+]i, and [K+]i are the intracellular Ca2+, Na+, and K+ concentrations in the caveolae, extracaveolae, and cytosol; [Ca2+]o, [Na+]o, and [K+]o are the extracellular Ca2+, Na+, and K+ concentrations.
Figure 2
Figure 2. β1-adrenoceptors phosphorylation.
β1-adrenoceptors phosphorylation above basal level after 15-minute application of 10 µM isoproterenol or 10 µM isoproterenol+PKA inhibitor H-89. Experimental data from Freedman et al. are shown with black bars with errors, simulation data are shown with gray bars. Effect of H-89 was simulated by setting [PKA]tot = 0 µM.
Figure 3
Figure 3. Normalized activity of adenylyl cyclases as functions of G and Gsβγ.
Panel A: Experimental normalized activity of AC5 (filled circles) and AC6 (unfilled circles) as functions of G . Simulated data for normalized activity of AC5/6 is shown by a solid line. Panel B: Experimental normalized activity of AC4 (filled circles from and unfilled circles from [38]) as functions of G. Simulated data for normalized activity of AC4/7 is shown by a solid line. Panel C: Experimental normalized activity of AC5 (filled circles) as functions of Gsβγ. Simulated data for normalized activity of AC5/6 is shown by a solid line. Panel D: Experimental normalized activity of AC4 (filled circles) as functions of Gsβγ. Simulated data for normalized activity of AC4/7 is shown by a solid line.
Figure 4
Figure 4. Adenylyl cyclase activity as a function of isoproterenol.
Panel A: Experimental data on AC activity (in pmol/mg/min) in mouse hearts and ventricular myocytes obtained after 10-minutes exposure to isoproterenol are shown by unfilled circles and filled circles . The solid line shows corresponding simulated AC activities at different concentrations of isoproterenol. Panel B: Desensitization of β1-ARs. Increase in adenylyl cyclase activities above basal level (in %) are measured at maximum (from 50th to 75th seconds, control, filled circles) and at two time moments (5 min and 30 min, unfilled circles and unfilled squares, respectively) after exposure to different concentrations of isoproterenol . Corresponding simulated data for the maximum, 5-minute, and 30-minute delays are shown by solid, dashed, and dash-dotted lines, respectively.
Figure 5
Figure 5. The effects of β1-adrenoceptor stimulation on PDE activities.
Panel A: Absolute total PDE activities and the activities of PDE2, PDE3, and PDE4 obtained experimentally from the mouse and rat hearts (in pmol/min/mg protein, bars with errors [44], [49]) and corresponding simulation data (bars without errors). Panel B: Fractional activities of PDE2, PDE3, and PDE4 obtained experimentally from the mouse and rat hearts (in %, bars with errors [44], [49]) and corresponding simulation data (bars without errors). Panel C: Partial activities of PDE2, PDE3, and PDE4 obtained experimentally from the particulate fraction of the rat hearts (in %, bars with errors [48]) and corresponding simulation data (bars without errors). In the experiments and simulations, PDE activities are obtained at fixed cAMP concentrations of 1 µM. Panel D: The effects of PDE inhibitor IBMX on cAMP levels in ventricular myocytes. Experimental data for rat and canine ventricular myocytes are shown by bars with errors, simulation data are shown by bars without errors. In the experiments with rat ventricular myocytes measurements were performed after 3-minute stimulations (5 µM isoproterenol, or 100 µM IBMX, or both) . In the experiments with canine ventricular myocytes measurements were performed after 5-minute stimulations (10 µM isoproterenol, or 10 µM IBMX, or both) . Simulated cAMP level is determined at the 3rd minute upon application of 5 µM isoproterenol, or 100 µM IBMX, or both.
Figure 6
Figure 6. The effects of β1-adrenoceptor stimulation on PKA activities.
Panel A: PKA I and PKA II activities as functions of cAMP. Experimental data for PKA I obtained by two methods are shown by filled and unfilled circles ; data for PKA II obtained by Beavo et al. . Corresponding simulated data are shown by a solid (PKA I) and a dashed (PKA II) line. Panel B: PKA activity ratio. Experimental data were obtained without (−cAMP) and with (+cAMP) externally applied 3 µM cAMP, both without and with 1 µM isoproterenol (black bars [57]). We also performed four simulations: no isoproterenol/basic level cAMP (−cAMP), no isoproterenol/3 µM cAMP (+cAMP), 1 µM isoproterenol/no externally applied cAMP (−cAMP), and 1 µM isoproterenol/3 µM cAMP (+cAMP). Then, the corresponding PKA ratios were calculated. Panel C: Protein kinase A inhibition by a heat-stable protein kinase inhibitor PKI. Experimentally, PKA activities were measured with and without PKI at different concentrations of cAMP, then their ratio was calculated (in %) and subtracted from 100% (filled circles, [54]). Corresponding simulation data for PKA I and PKA II are shown by solid and dashed lines. Concentration of [PKI]tot = 2·0.2·[PKA]tot.
Figure 7
Figure 7. The effects of β1-adrenoceptor stimulation on activities of I-1 and PP1.
Panel A: Relative I-1 activity in ventricular myocytes in control (left bars) and upon stimulation with 1 µM isoproterenol (right bars). Experimental data for guinea pig hearts are shown by black bars, simulation data with our model are shown by gray bars. Panel B: Relative PP1 activity in WT and I-1 knockout mouse hearts. Experimental data are shown by black bars, our simulations – by gray bars. Experimental PP1 activity from I-1 knockout mouse hearts is normalized to 100%.
Figure 8
Figure 8. cAMP and PKA dynamics in mouse ventricular myocytes.
Panel A: cAMP dynamics in ventricular myocytes. Experimental data of normalized cAMP in mouse and rabbit ventricular myocytes are shown by unfilled and filled circles, respectively; simulation data is shown by a solid line. Panel B: PKA dynamics in ventricular myocytes. Experimental data of normalized PKA activity in rabbit ventricular myocytes are shown by unfilled circles; simulation data is shown by a solid line. Data in Panels A and B was obtained upon application of 1 µM isoproterenol.
Figure 9
Figure 9. The effects of β1-adrenoceptor stimulation on the L-type Ca2+ current.
Panel A: Markov model of the L-type Ca2+ channel. State diagram consists of two similar sub-diagrams for non-phosphorylated (upper sub-diagram) and phosphorylated states (lower sub-diagram). C1, C2, C3, C4, and CP are closed states; O is the open state; I1, I2, and I3 are inactivated states; C1p, C2p, C3p, C4p, and CPp are closed phosphorylated states; Op is the open phosphorylated state; and I1p, I2p, and I3p are phosphorylated inactivated states. The rate constants α, αp, and β are voltage-dependent; γ is calcium dependent; kco, koc, kcop, Kpcf and Kpcb, are voltage-insensitive; and kphos and kdephos are the phosphorylation and dephosphorylation rates, respectively (see Appendix S1). Panel B: Time course of the peak values of L-type Ca2+ current and L-type Ca2+ channel phosphorylation level upon stimulation with 1 µM isoproterenol. Experimental data for peak ICaL is obtained by a series of pulses to 0 mV for 200 ms from a holding potential of −80 mV with a frequency 0.2 Hz . Modeling data are obtained by a series of pulses to 0 mV for 50 ms from a holding potential of −80 mV with a frequency 0.04 Hz. Increase in phosphorylation level is determined as a fractional increase related to the total increase in phosphorylation of L-type Ca2+ channels at 150th s after application of isoproterenol. Panel C: Peak L-type Ca2+ current as a function of isoproterenol concentration. Experimental data are obtained by Kim et al. (filled circles), Sako et al. (unfilled circles), and Mitarai et al. (filled squares). Simulation data is obtained by a voltage pulse to 0 mV from a holding potential of −80 mV after a 600-second exposure to different concentrations of isoproterenol. Simulation data for the total cellular ICaL,tot, the caveolae-localized ICaL,cav, and the extracaveolae-localized ICaL,ecav are shown by black, green, and red solid lines, respectively. Panel D: Simulated time course of the L-type Ca2+ currents in control (solid line), after 1000-s exposure to PP1/PP2A inhibitor Calyculin A (65% of PP1/PP2A activity inhibition, dashed line), and after 600-s exposure to 1 µM isoproterenol (dotted line). Currents are obtained by a voltage pulses to 0 mV from a holding potential of −80 mV and without Ca2+-induced Ca2+ release to account for heavy buffer conditions. Insert in Panel D: Same simulations performed with intact Ca2+-induced Ca2+ release. Panel E: Peak current-voltage (I–V) relationships for ICaL in control (filled circles) and after exposure to Calyculin A (unfilled circles) and isoproterenol (filled squares). Panel F: Steady-state inactivation relationships for ICaL in control (filled circles) and after exposure to Calyculin A (unfilled circles) and isoproterenol (filled squares). Panel G: Normalized maximum conductance (G/Gmax) for ICaL as functions of voltage in control (filled circles) and after exposure to Calyculin A (unfilled circles) and isoproterenol (filled squares). In Panels E, F, and G, currents are obtained by the two-pulse protocols: a 500-ms depolarizing first pulse to between −70 and +50 mV (in 10-mV increment) is applied from a holding potential of −80 mV; this is followed by a second 500-ms pulse to +10 mV. Simulations are performed without Ca2+-induced Ca2+ release to account for heavy buffer conditions.
Figure 10
Figure 10. The effects of β1-adrenoceptor stimulation on the fast Na+ current.
Panel A: Markov model of the fast Na+ channel. State diagram consists of two similar sub-diagrams for non-phosphorylated (upper sub-diagram) and phosphorylated-trafficked states (lower sub-diagram). CNa1, CNa2, and CNa3 are closed states; ONa is the open state; IFNa, I1Na, and I2Na are the fast, intermediate, and slow inactivated states, respectively; ICNa2 and ICNa3 are closed-inactivated states; CNa1p, CNa2p, and CNa3p are closed phosphorylated states; ONap is the open phosphorylated state; and IFNap, I1Nap, I2Nap, ICNa2p, and ICNa3p are phosphorylated inactivated states. The rate constants for activation, deactivation, inactivation, phosphorylation-trafficking, and dephosphorylation are given in Appendix S1. Panel B: Time course of the activation of the fast Na+ current upon application 0.1 µM isoproterenol. Experimental data of Matsuda et al. obtained for the normalized peak INa in rabbit ventricular myocytes is shown by closed circles. Data is obtained with 40-ms pulses from a holding potential of −100 mV to −30 mV at stimulation frequency 0.2 Hz. A solid line shows the time course of simulated data on relative INa phosphorylation upon application of 0.1 µM isoproterenol. A dashed line shows the time course of the simulated normalized peak INa after application of 0.1 µM isoproterenol. The simulated currents are obtained with 20-ms pulses from a holding potential of −140 mV to −30 mV at stimulation frequency 0.04 Hz. Panel C: An increase in peak INa availability upon application of different concentrations of isoproterenol (in %). Experimental data by Kirstein et al. obtained from rat ventricular myocytes are shown by black bars with errors; corresponding simulation data are shown by gray bars. Peak current-voltage (Panel D) and steady-state inactivation (Panel E) relationships for the fast Na+ current in ventricular myocytes upon stimulation with 0.1 µM isoproterenol. Experimental data for rats in the absence (unfilled circles) and presence (filled circles) of 0.1 µM isoproterenol are obtained by Kirstein et al. (holding potential is −100 mV, conditioning pulse duration is 2,500 ms; isoproterenol data is obtained after 10 min of application). Simulated data are shown by solid (no isoproterenol) and dashed (10 min after application of 0.1 µM isoproterenol) lines (data are obtained by two-pulse protocol, holding potential is −140 mV, first pulse duration is 500 ms for voltages from −140 to +40 mV in 10 mV steps, second pulse duration is 50 ms at voltage −20 mV). Isoproterenol increases INa availability, but does not affect gating properties.
Figure 11
Figure 11. The effects of β1-adrenoceptor stimulation on ryanodine receptors.
Panel A: Markov model of ryanodine receptors. State diagram consists of two similar sub-diagrams for non-phosphorylated (upper sub-diagram) and phosphorylated states (lower sub-diagram). C1 and C2 are closed states; O1 and O2 are open states; C1p and C2p are closed phosphorylated states; O1p and O2p are open phosphorylated states. The rate constants from C1 to O1, from O1 to O2, from C1p to O1p, and from O1p to O2p are Ca2+-dependent; and kphos and kdeph are the phosphorylation and dephosphorylation rates, respectively (see Appendix S1). Panel B: Time course of the relative phosphorylation level of RyRs upon activation of the β1-adrenergic signaling system. Experimental data of Xiao et al. (filled circles) are obtained upon stimulation of rat ventricular myocytes with 1 µM isoproterenol; experimental data of Takasago et al. (filled squares) are obtained from canine ventricular myocytes with endogenous PKA by application of [γ-32P]ATP. Modeling data are obtained by application of 1 µM isoproterenol. Increase in phosphorylation level is determined as a fractional increase related to the maximum increase in phosphorylation of RyRs after activation of the β1-adrenergic signaling system. Panel C: Relative phosphorylation level of RyRs at different concentrations of isoproterenol. Experimental data of Xiao et al. (filled circles) obtained upon stimulation of rat ventricular myocytes for 15 minutes. Simulation data are obtained after 10-minute exposure to different concentrations of isoproterenol. Panel D: Effects of PKA on opening probability of RyRs as function of cytosolic Ca2+ concentration. Experimental data of Xiao et al. are obtained for cardiac RyRs upon application of active (filled circles) and boiled (unfilled circles) PKA at relatively small luminal Ca2+ of 45 nM; experimental data of Xiao et al. (filled squares) for RyRs are obtained from mouse ventricular myocytes. Simulation data for mouse ventricular myocytes in the absence and presence of PKA are obtained at intracellular [Ca2+]i concentration ranged from 0.01 to 10 µM and are shown by dashed and solid lines. Experimental data obtained at small luminal Ca2+ concentration shows larger sensitivity of RyRs to cytosolic Ca2+.
Figure 12
Figure 12. The effects of β1-adrenoceptor stimulation on the Na+-K+ pump.
Panel A: Experimental time course of a relative decrease in the intracellular [Na+]i concentration (filled circles) obtained by Despa et al. from mouse ventricular myocytes after application of 1 µM isoproterenol and corresponding simulated time course of an increase in relative phosphorylation level of phospholemman obtained using our model (solid line). Panel B: Experimental data on a relative increase in INaK current (filled circles) obtained by Gao et al. from guinea pig ventricular myocytes at different concentrations of isoproterenol. Corresponding simulation data with our model on a relative increase in phosphorylation of phospholemman is shown by a solid line. Panel C: Experimental (black bars with errors [100]) and simulated (gray bars) data on intracellular [Na+]i concentration before (control) and after 10-minutes application of 1 µM isoproterenol (Iso).
Figure 13
Figure 13. The effects of β1-adrenoceptor stimulation on IKur and IKto,f.
Panel A: Experimental time course of the relative increase in the ultra-rapidly activating delayed-rectifier K+ current IKur obtained by Li et al. from human atrial myocytes after application of 1 µM isoproterenol (line with filled circles) and corresponding simulated time course of an increase in IKur obtained with our model (solid line). Simulation data is obtained with 200-ms pulses from a holding potential of −100 mV to +40 mV at stimulation frequency 0.02 Hz. Panel B: Experimental data on a relative increase in IKur current (filled circles) obtained by Yue et al. from canine atrial myocytes at different concentrations of isoproterenol. Corresponding simulation data with our model on relative increase in IKur are shown by a solid line. Simulation data is obtained with 4.5-s pulses from a holding potential of −90 mV to 0 mV after 800-s exposure to different concentrations of isoproterenol. Panel C: Experimental (human atrial myocytes , solid lines with circles) and simulated (solid and dashed lines) data on current-voltage relationships for IKur current. Experimental data for control conditions and those obtained after application of 1 µM isoproterenol are shown by unfilled and filled circles, respectively. Simulated data for control conditions are shown by a solid line, and 1 µM isoproterenol simulations are shown by a dashed line. Simulated currents are obtained by 4.5-s depolarizing pulses to between −80 and +50 mV (in 10-mV increment) from a holding potential of −90 mV. Panel D: Experimental time course of the relative decrease in the rapidly recovering transient outward K+ current IKto,f obtained by Zhang et al. from mouse Schwann cells after application of 1 µM forskolin (filled circles) or 10 µM db-cAMP (unfilled circles), and corresponding simulated time course of a relative decrease in IKto,f phosphorylation obtained with our model after stimulation with 10 µM isoproterenol (solid line). Panel E: Simulated time course of IKto,f traces obtained by depolarization pulses to −5 mV from a holding potential of −100 mV for control (solid line) and after stimulation with 10 µM isoproterenol (dashed line). Panel F: Simulated data for G/Gmax (black lines) and steady-state inactivation relationships (gray lines) obtained for IKto,f with two-pulse protocol (P1 stimuli from −100 to +50 mV in 10 mV intervals for 500 ms, following P2 pulse to +50 mV for 500 ms; holding potential is −100 mV) in control (solid lines) and after application of 10 µM isoproterenol (dashed lines).
Figure 14
Figure 14. The effects of β1-adrenoceptor stimulation on phospholamban and troponin I.
Panel A: Experimental time courses of the phospholamban phosphorylation (in %) obtained from rat hearts , and mouse ventricular myocytes . Data Karczewski et al. are obtained with application of 0.5 µM PKA catalytic subunit; data Kuschel et al. and Li et al. are obtained with application of 1 µM isoproterenol. Simulated time course of PLB phosphorylation is shown by a solid line. Panel B: PLB phosphorylation (in %) as functions of isoproterenol concentration. Experimental data from rat hearts , were obtained after 2-minute exposure to isoproterenol; data from guinea pig hearts were obtained after 1-minute exposure to isoproterenol; and data from rat ventricular myocytes were obtained after 3-minute exposure to isoproterenol. Simulated data after 2-minute exposure to different concentrations of isoproterenol is shown by a solid line. Panel C: Experimental time courses of the troponin I phosphorylation (in %) obtained from mouse ventricular myocytes after application of 1 µM isoproterenol. Simulated time course of troponin I phosphorylation is shown by a solid line. Panel D: Troponin I phosphorylation (in %) as functions of isoproterenol concentration. Experimental data from rat ventricular myocytes were obtained after 3-minute exposure to isoproterenol. Simulated data after 2-minute exposure to different concentrations of isoproterenol is shown by a solid line.
Figure 15
Figure 15. The effects of β1-adrenoceptor stimulation on the dynamics of cAMP and PKA.
Panel A: Simulated time courses of cAMP concentrations in caveolae (thin solid line), extracaveolae (dashed line), and cytosolic compartments (dotted line), and in the whole cell volume (bold solid line) after application of 1 µM isoproterenol. Panel B: Simulated time courses of PKA catalytic subunit concentrations in caveolae (thin solid line), extracaveolae (dashed line), and cytosolic compartments (dotted line), and in the whole cell volume (bold solid line) after application of 1 µM isoproterenol. Panel C: Simulated time courses of cAMP production rate by adenylyl cyclases (solid line) and cAMP degradation rate by phosphodiesterases (dashed line) after application of 1 µM isoproterenol. Panel D: Simulated time course of cAMP fluxes between caveolae and extracaveolae (solid line), caveolae and cytosol (dashed line), and extracaveolae and cytosol (dotted line) after application of 1 µM isoproterenol. Fluxes are normalized to the cell volume Vcell.
Figure 16
Figure 16. The effects of PDE3 and PDE4 inhibition on cAMP dynamics upon activation of β1-adrenergic receptors.
Panel A: Simulated time courses of cellular cAMP concentrations for control conditions (solid line), upon inhibition of PDE3 (dashed line), and upon inhibition of PDE4 (dotted line) after sustained application of 0.1 µM isoproterenol at time moment t = 0 s. Activities of PDE3 or PDE4 are inhibited by 90% to simulate the effects of corresponding selective inhibitors, cilostamide or milrione for PDE3, or rolipam or Ro 20–1724 for PDE4. Panel B: Simulated time courses of cellular cAMP concentrations for control conditions (solid line), upon inhibition of PDE3 (dashed line), and upon inhibition of PDE4 (dotted line) after pulsed application of 0.1 µM isoproterenol at time moment t = 200 s for 30 s (thick solid line). The degrees of inhibition of PDE3 and PDE4 are the same as in Panel A.
Figure 17
Figure 17. Simulated action potentials and underlying ionic currents of the isolated ventricular cell model.
Simulated action potentials and underlying ionic currents are shown for control conditions and after application of 1 µM isoproterenol at two pacing frequencies 1 Hz (Panels A–E) and 5 Hz (Panels F–J) (Istim = 80 pA/pF, τstim = 1.0 ms). Panels A and F: Simulated action potentials for control conditions (solid line) and after isoproterenol application (dashed line). Panels B, D, G, and I: Currents underlying the AP for control condition. Panel C, E, H, and J: Currents underlying the AP after isoproterenol application. The scales for the relatively large fast Na+ current, INa, are given on the right axis in Panels B, C, G and H. APs and ionic currents are shown after 300 s stimulation. In Panels A, C, E, F, H, and J 1 µM isoproterenol is applied at time t = 0 s.
Figure 18
Figure 18. Simulated and experimental [Ca2+]i transients and their characteristics in an isolated ventricular cell for control conditions and after application of isoproterenol.
Panel A: Simulated [Ca2+]i transients for control conditions (solid line) and after 1 µM isoproterenol application (dashed line) obtained with 1 Hz-stimulation. Panel B: Simulated [Ca2+]i transients for control conditions (solid line) and after 1 µM isoproterenol application (dashed line) obtained with 5 Hz-stimulation. Panel C: Simulated diastolic (filled symbols) and systolic (unfilled symbols) [Ca2+]i magnitudes for control conditions (circles) and after 1 µM isoproterenol application (triangles) as functions of stimulation frequency. Panel D: Decay time constants for intracellular [Ca2+]i transients for control conditions and after 1 µM isoproterenol application as functions of stimulation frequency. Simulated data are shown by solid (control) and dashed (1 µM isoproterenol) lines. The lines with symbols show experimental data from Benkunsky et al. ; experimental data from Knollmann et al. are shown by squares. Panel E: Increase in [Ca2+]i transient amplitudes after application of isoproterenol (folds). Model data and data of Wang et al. and Liu et al. are obtained at 1 Hz and 1 µM isoproterenol; data of Despa et al. are obtained at 2 Hz and 1 µM isoproterenol; data of Knollmann et al. are obtained at 1 Hz and 0.5 µM isoproterenol. All simulation data in this figure are obtained after 300-s stimulations and exposure to 1 µM isoproterenol.
Figure 19
Figure 19. Ca2+ fluxes and the SR Ca2+ load.
Simulated major integral Ca2+ fluxes during one cardiac cycle in the isolated ventricular cell model for control conditions (Panels A and C) and after application of 1 µM isoproterenol (Panels B and D). Pacing frequencies are 1 Hz (Panels A and B) and 5 Hz (Panels C and D). Major integral Ca2+ fluxes are shown after 300 s of stimulation. In Panels B and D 1 µM isoproterenol is applied at time t = 0 s. Here, JCaL is the Ca2+ entering the cell through L-type Ca2+ channels; Jup – Jleak is the uptake Ca2+ from the cytosol to the network SR with subtracted Ca2+ leak from the SR to the cytosol; JNaCa is the Ca2+ outflux from the cytosol through the Na+/Ca2+ exchanger; and JpCa is the Ca2+ outflux through the sarcolemmal Ca2+ pump. Panel E: Increase in the SR Ca2+ load after 300-s application of isoproterenol. Model data are shown for stimulation frequencies 1, 2, 3, 4, and 5 Hz; experimental data of Liu et al. and Fernandez-Velasco et al. are obtained at 1 µM isoproterenol; data of Knollmann et al. are obtained at 0.5 µM isoproterenol.
Figure 20
Figure 20. Dynamics of [Ca2+]i transients and [Na+]i concentrations upon stimulation of β1-adrenoceptors.
Panel A: Simulated peak values of [Ca2+]i transient as function of time for control conditions (solid line) and after 1 µM isoproterenol application at t = 0 s (dashed line). Panel B: Simulated intracellular [Na+]i concentrations as function of time for control conditions (solid line) and after 1 µM isoproterenol application at t = 0 s (dashed line). In both panels, stimulation frequency is 1 Hz.
Figure 21
Figure 21. The effects of isoproterenol on negative staircase of [Ca2+]i transients.
Panel A: Simulated [Ca2+]i transients as function of time for control conditions show clear negative staircase effect. Panel B: Simulated [Ca2+]i transients as function of time after 1 µM isoproterenol application at t = 0 s does not show negative staircase effect. In both panels, stimulation frequency is 1 Hz.
Figure 22
Figure 22. The effects of isoproterenol on integral Na+ fluxes.
Simulated major integral Na+ fluxes during one cardiac cycle in the isolated ventricular cell model are shown for control conditions (Panels A and C) and after application of 1 µM isoproterenol (Panels B and D). Pacing frequencies are 1 Hz (Panels A and B) and 5 Hz (Panels C and D). Major integral Na+ fluxes are shown after 300 s of stimulation. In Panels B and D 1 µM isoproterenol is applied at time t = 0 s. Here, JNav is the Na+ entering the caveolae compartment through the fast Na+ channels; JNab is the background Na+ influx; JNaCa is the Na+ influx to the cytosol through the Na+/Ca2+ exchanger; and JNaK is the Na+ outflux through the Na+-K+ pump.
Figure 23
Figure 23. The effects of two subpopulations of the L-type Ca2+ current block on the action potentials and [Ca2+]i transients.
Simulated effects of two subpopulations of the L-type Ca2+ current block on the action potentials and [Ca2+]i transients in the isolated ventricular cell model are shown for control conditions and after application of 1 µM isoproterenol at pacing frequency 1 Hz (Istim = 80 pA/pF, τstim = 1.0 ms). Panels A–C: Control conditions; Panels D–F: Isoproterenol is applied. Panels A and D: Simulated action potentials for control conditions (solid black line), after ICaL,ecav block (green line), and after ICaL,cav block (red line). Panels B and E: Simulated ICaL currents. Panel C and F: Simulated [Ca2+]i transients. APs and ionic currents are shown after 300 s stimulation. 1 µM isoproterenol is applied at time t = 0 s.

Similar articles

Cited by

References

    1. Rudy Y, Ackerman MJ, Bers DM, Clancy CE, Houser SR, et al. (2008) System approach to understanding electromechanical activity in the human heart: a National Heart, Lung, and Blood Institute workshop summary. Circulation 118: 1202–1211. - PMC - PubMed
    1. Schaub MC, Hefti MA, Zaugg M (2006) Integration of calcium with the signaling network in cardiac myocytes. J Mol Cell Cardiol 41: 183–214. - PubMed
    1. Wachter SB, Gilbert EM (2012) Beta-adrenergic receptors, from their discovery and characterization through their manipulation to beneficial clinical application. Cardiology 122: 104–112. - PubMed
    1. Ho D, Yan L, Iwatsubo K, Vatner DE, Vatner SF (2010) Modulation of β-adrenergic receptor signaling in heart failure and longevity: targeting adenylyl cyclase type 5. Heart Fail Rev 15: 495–512. - PMC - PubMed
    1. Reincober J, Tscheschner H, Pleger ST, Most P, Katus HA, et al. (2012) Targeting GRK2 by gene therapy for heart failure: benefits above β-blockade. Gene Ther 19: 686–693. - PubMed

Publication types

Substances

LinkOut - more resources