

Impaired angiogenesis during fracture healing in GPCR kinase 2 interacting protein-1 (GIT1) knock out mice
- PMID: 24586541
- PMCID: PMC3929643
- DOI: 10.1371/journal.pone.0089127
Impaired angiogenesis during fracture healing in GPCR kinase 2 interacting protein-1 (GIT1) knock out mice
Abstract
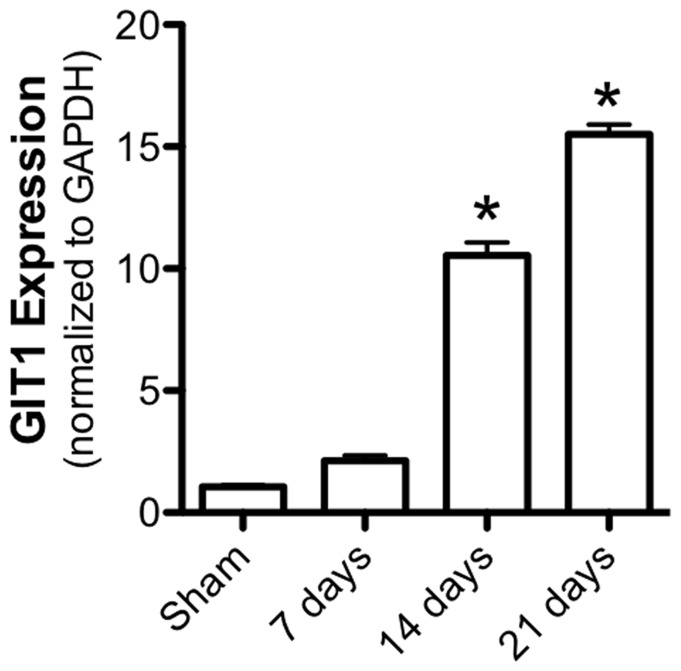
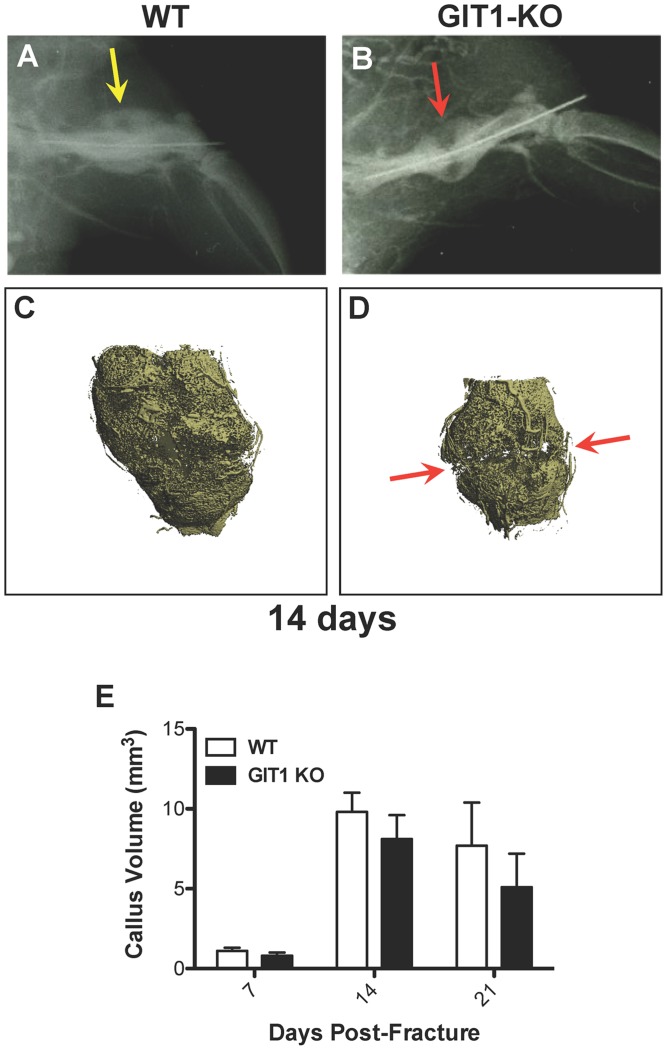
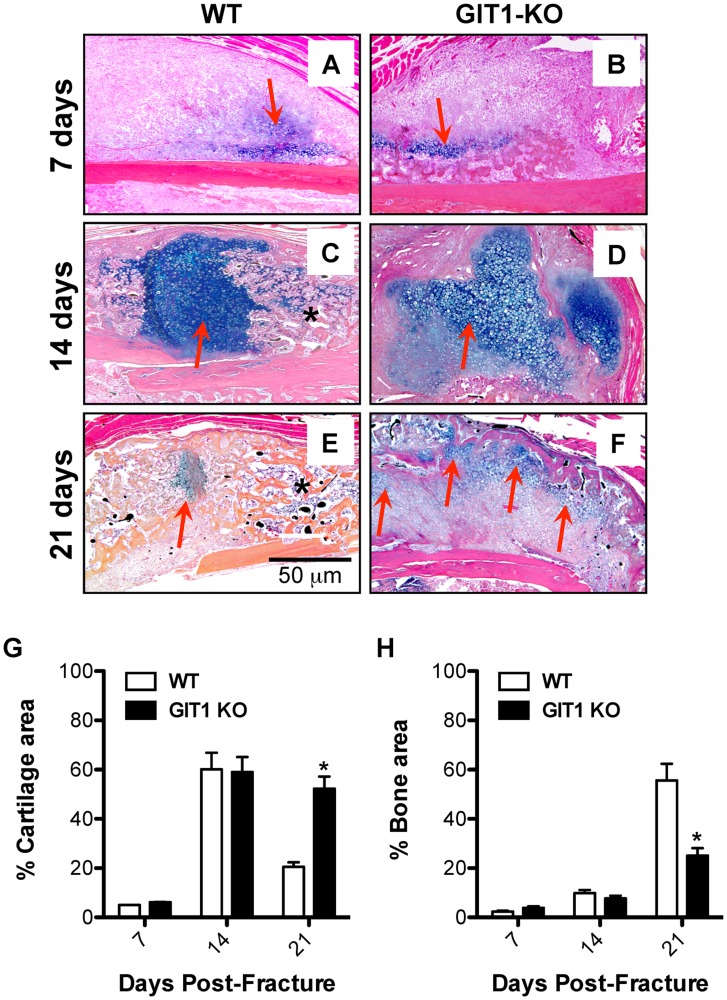
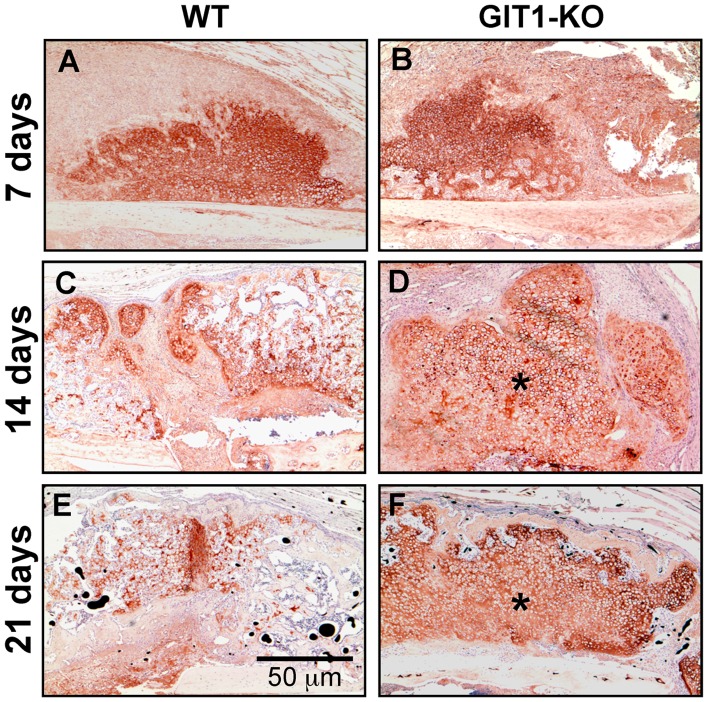
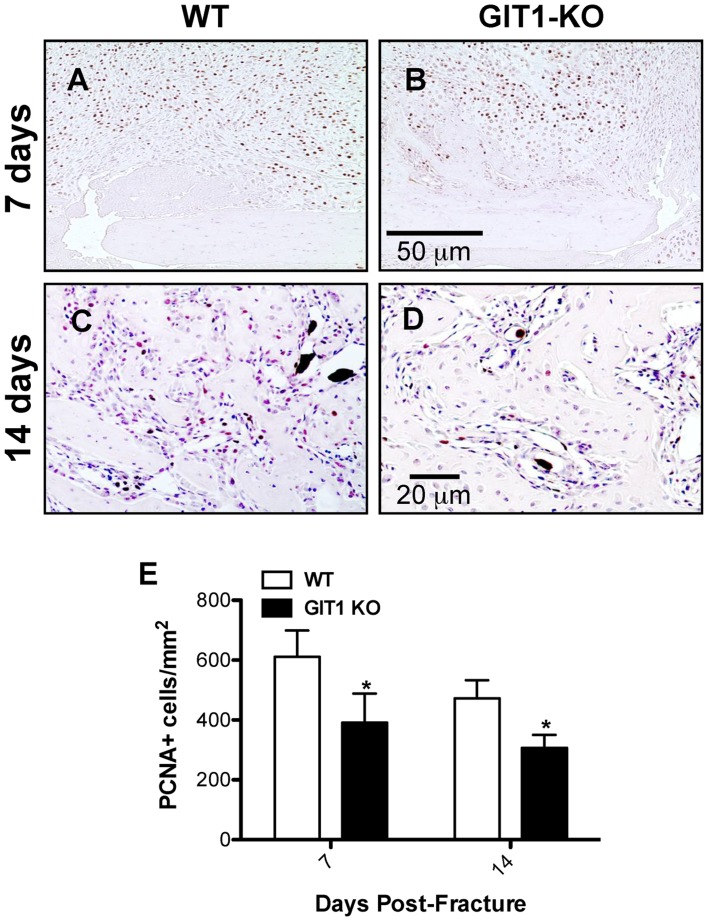
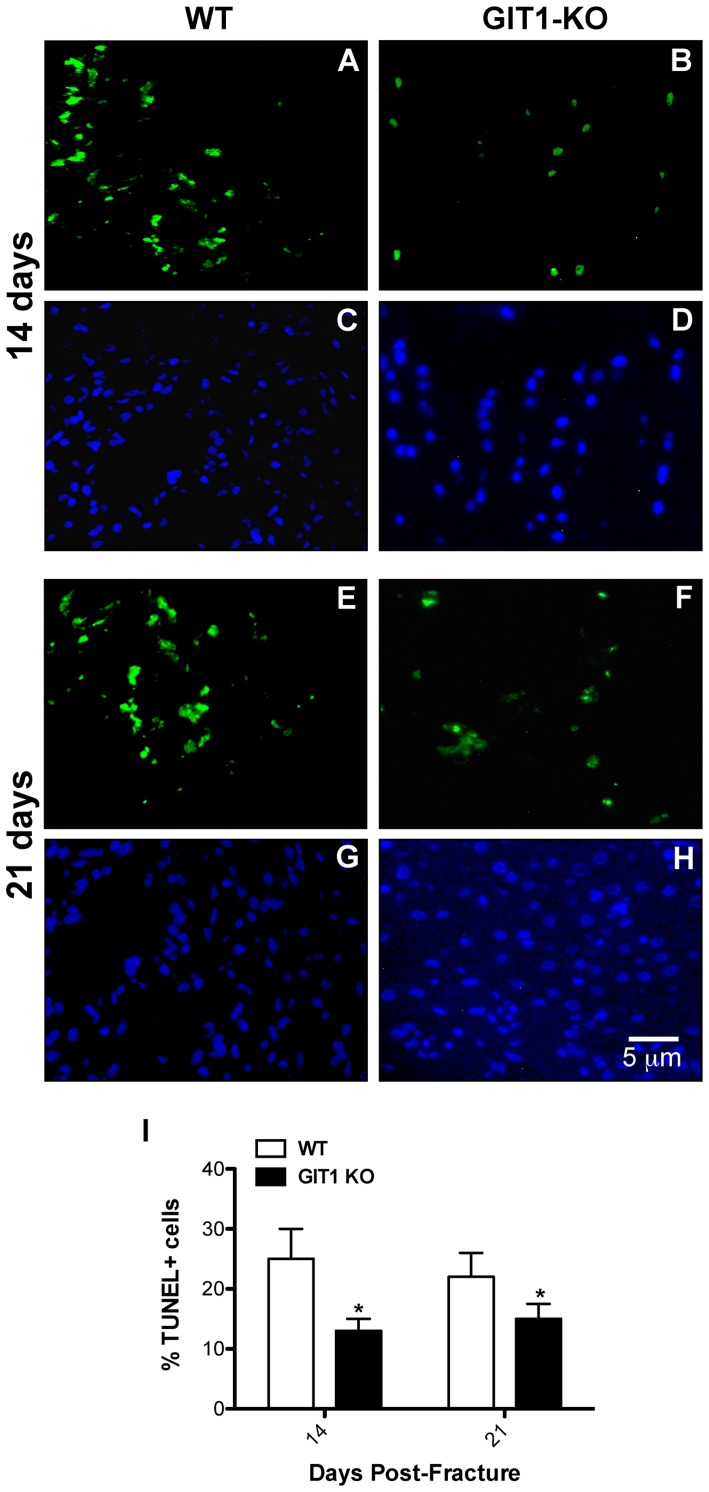
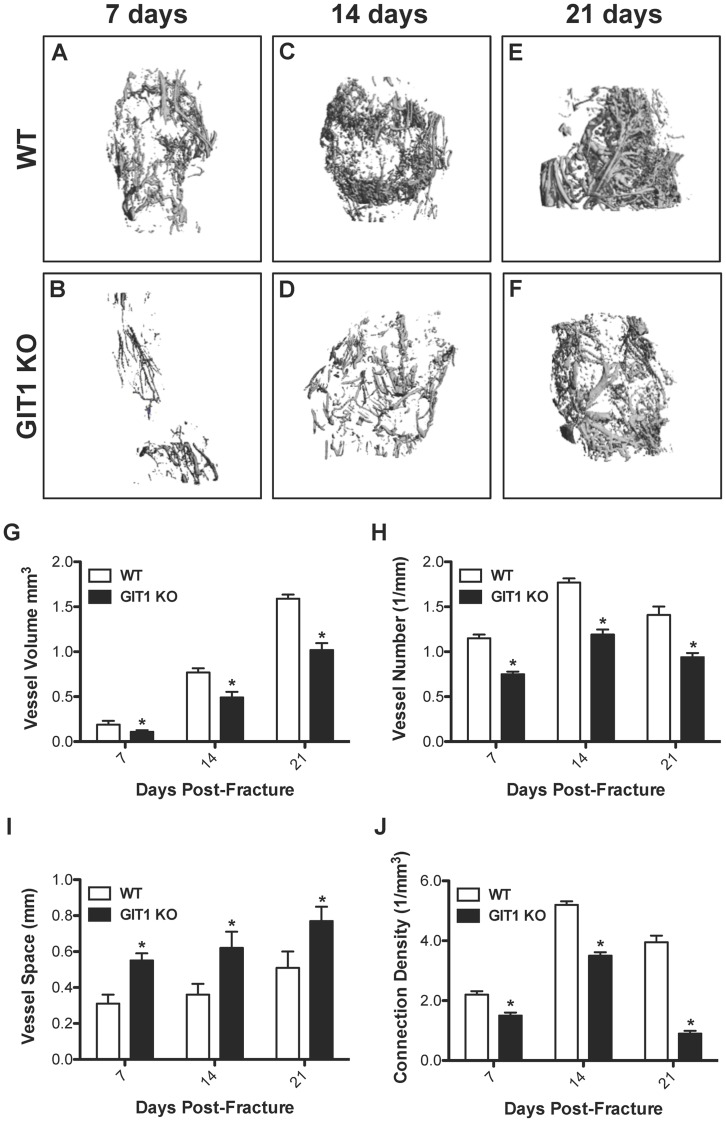
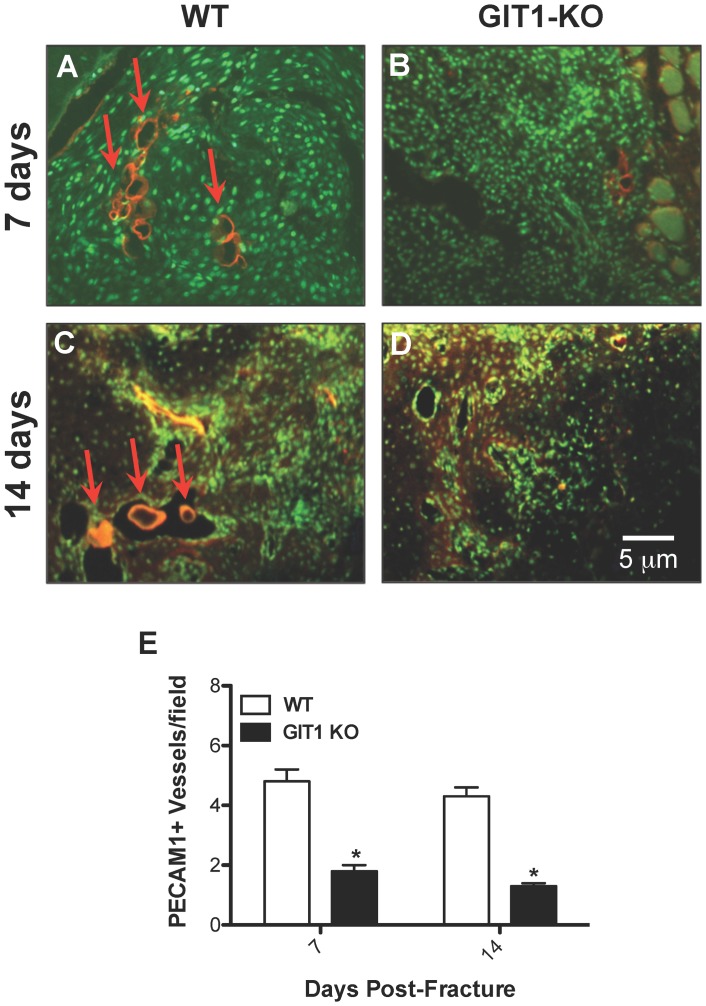
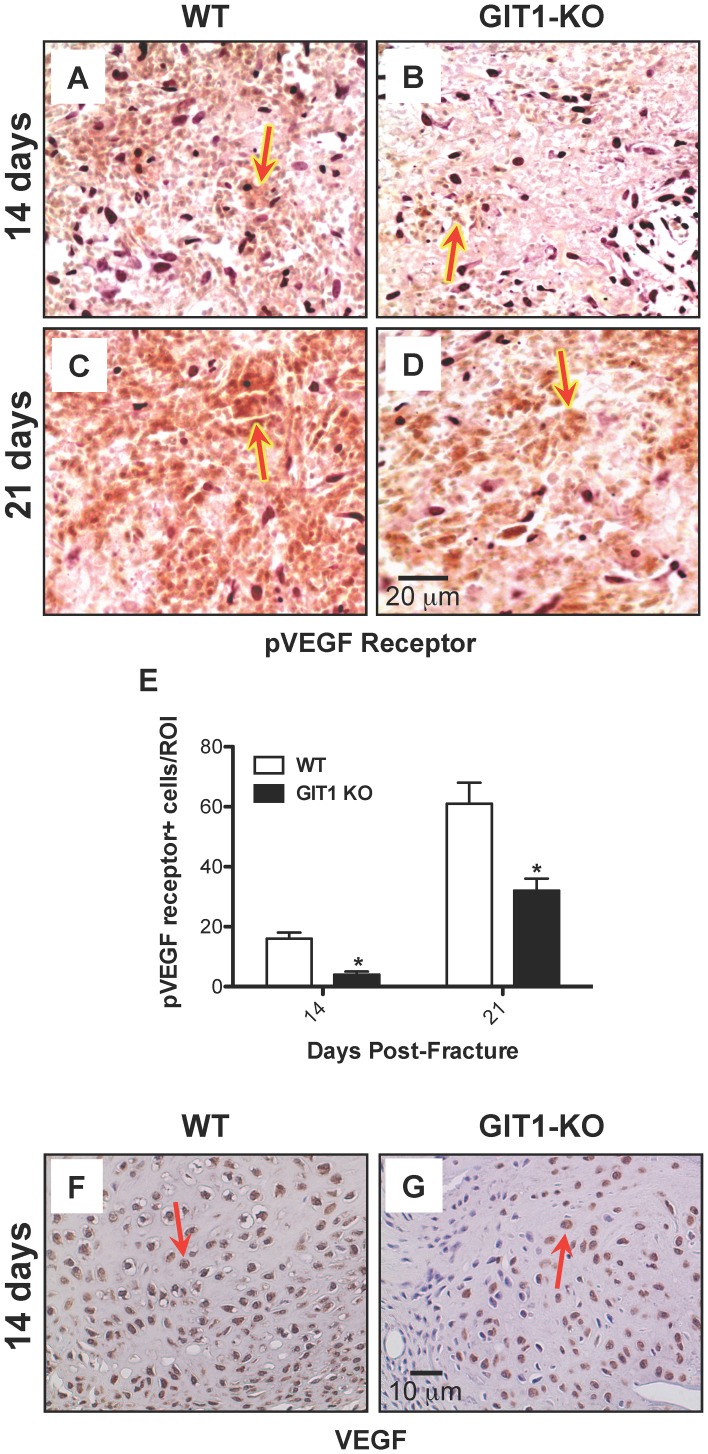
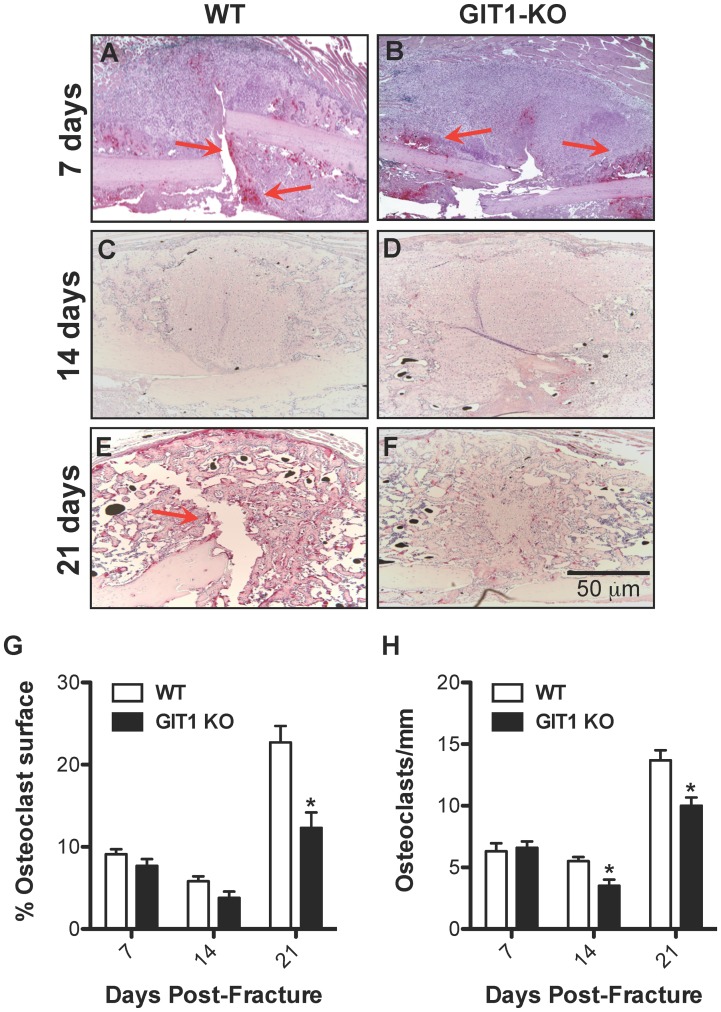
G protein coupled receptor kinase 2 (GRK2) interacting protein-1 (GIT1), is a scaffold protein that plays an important role in angiogenesis and osteoclast activity. We have previously demonstrated that GIT1 knockout (GIT1 KO) mice have impaired angiogenesis and dysregulated osteoclast podosome formation leading to a reduction in the bone resorbing ability of these cells. Since both angiogenesis and osteoclast-mediated bone remodeling are involved in the fracture healing process, we hypothesized that GIT1 participates in the normal progression of repair following bone injury. In the present study, comparison of fracture healing in wild type (WT) and GIT1 KO mice revealed altered healing in mice with loss of GIT1 function. Alcian blue staining of fracture callus indicated a persistence of cartilagenous matrix in day 21 callus samples from GIT1 KO mice which was temporally correlated with increased type 2 collagen immunostaining. GIT1 KO mice also showed a decrease in chondrocyte proliferation and apoptosis at days 7 and 14, as determined by PCNA and TUNEL staining. Vascular microcomputed tomography analysis of callus samples at days 7, 14 and 21 revealed decreased blood vessel volume, number, and connection density in GIT1 KO mice compared to WT controls. Correlating with this, VEGF-A, phospho-VEGFR2 and PECAM1 (CD31) were decreased in GIT1 KO mice, indicating reduced angiogenesis with loss of GIT1. Finally, calluses from GIT1 KO mice displayed a reduced number of tartrate resistant acid phosphatase-positive osteoclasts at days 14 and 21. Collectively, these results indicate that GIT1 is an important signaling participant in fracture healing, with gene ablation leading to reduced callus vascularity and reduced osteoclast number in the healing callus.
Conflict of interest statement
Figures
Similar articles
-
GIT1 gene deletion delays chondrocyte differentiation and healing of tibial plateau fracture through suppressing proliferation and apoptosis of chondrocyte.BMC Musculoskelet Disord. 2017 Jul 28;18(1):320. doi: 10.1186/s12891-017-1653-7. BMC Musculoskelet Disord. 2017. PMID: 28754105 Free PMC article.
-
GIT1 is critical for formation of the CD31hiEmcnhi vessel subtype in coupling osteogenesis with angiogenesis via modulating preosteoclasts secretion of PDGF-BB.Bone. 2019 May;122:218-230. doi: 10.1016/j.bone.2019.03.006. Epub 2019 Mar 7. Bone. 2019. PMID: 30853660
-
GPCR kinase 2 interacting protein 1 (GIT1) regulates osteoclast function and bone mass.J Cell Physiol. 2010 Nov;225(3):777-85. doi: 10.1002/jcp.22282. J Cell Physiol. 2010. PMID: 20568227 Free PMC article.
-
Biglycan potentially regulates angiogenesis during fracture repair by altering expression and function of endostatin.Matrix Biol. 2016 May-Jul;52-54:141-150. doi: 10.1016/j.matbio.2016.03.008. Epub 2016 Apr 9. Matrix Biol. 2016. PMID: 27072616 Free PMC article. Review.
-
Osteoimmunology of Fracture Healing.Curr Osteoporos Rep. 2024 Jun;22(3):330-339. doi: 10.1007/s11914-024-00869-z. Epub 2024 Apr 15. Curr Osteoporos Rep. 2024. PMID: 38616228 Free PMC article. Review.
Cited by
-
Dendronized chitosan hydrogel with GIT1 to accelerate bone defect repair through increasing local neovascular amount.Bone Rep. 2023 Aug 30;19:101712. doi: 10.1016/j.bonr.2023.101712. eCollection 2023 Dec. Bone Rep. 2023. PMID: 37744736 Free PMC article.
-
GIT1 promotes lung cancer cell metastasis through modulating Rac1/Cdc42 activity and is associated with poor prognosis.Oncotarget. 2015 Nov 3;6(34):36278-91. doi: 10.18632/oncotarget.5531. Oncotarget. 2015. PMID: 26462147 Free PMC article.
-
GIT1 gene deletion delays chondrocyte differentiation and healing of tibial plateau fracture through suppressing proliferation and apoptosis of chondrocyte.BMC Musculoskelet Disord. 2017 Jul 28;18(1):320. doi: 10.1186/s12891-017-1653-7. BMC Musculoskelet Disord. 2017. PMID: 28754105 Free PMC article.
-
Lack of endogenous parathyroid hormone delays fracture healing by inhibiting vascular endothelial growth factor‑mediated angiogenesis.Int J Mol Med. 2018 Jul;42(1):171-181. doi: 10.3892/ijmm.2018.3614. Epub 2018 Apr 3. Int J Mol Med. 2018. PMID: 29620150 Free PMC article.
-
Macrophage GIT1 Contributes to Bone Regeneration by Regulating Inflammatory Responses in an ERK/NRF2-Dependent Way.J Bone Miner Res. 2020 Oct;35(10):2015-2031. doi: 10.1002/jbmr.4099. Epub 2020 Jul 9. J Bone Miner Res. 2020. PMID: 32460388 Free PMC article.
References
-
- Einhorn TA (1998) The cell and molecular biology of fracture healing. ClinOrthop: S7–21. - PubMed
-
- Gerstenfeld LC, Cullinane DM, Barnes GL, Graves DT, Einhorn TA (2003) Fracture healing as a post-natal developmental process: molecular, spatial, and temporal aspects of its regulation. JCell Biochem 88: 873–884. - PubMed
-
- Thompson Z, Miclau T, Hu D, Helms JA (2002) A model for intramembranous ossification during fracture healing. Journal of Orthopaedic Research 20: 1091–1098. - PubMed
-
- Li G, White G, Connolly C, Marsh D (2002) Cell proliferation and apoptosis during fracture healing. J Bone Miner Res 17: 791–799. - PubMed
Publication types
MeSH terms
Substances
Grants and funding
LinkOut - more resources
Full Text Sources
Other Literature Sources
Molecular Biology Databases
Research Materials
Miscellaneous
