. 2014 Feb 26;9(2):e89131.
doi: 10.1371/journal.pone.0089131. eCollection 2014.

A mixed modeling approach to predict the effect of environmental modification on species distributions

Affiliations

A mixed modeling approach to predict the effect of environmental modification on species distributions

Francesco Cozzoli et al. PLoS One. .

Abstract

Human infrastructures can modify ecosystems, thereby affecting the occurrence and spatial distribution of organisms, as well as ecosystem functionality. Sustainable development requires the ability to predict responses of species to anthropogenic pressures. We investigated the large scale, long term effect of important human alterations of benthic habitats with an integrated approach combining engineering and ecological modelling. We focused our analysis on the Oosterschelde basin (The Netherlands), which was partially embanked by a storm surge barrier (Oosterscheldekering, 1986). We made use of 1) a prognostic (numerical) environmental (hydrodynamic) model and 2) a novel application of quantile regression to Species Distribution Modeling (SDM) to simulate both the realized and potential (habitat suitability) abundance of four macrozoobenthic species: Scoloplos armiger, Peringia ulvae, Cerastoderma edule and Lanice conchilega. The analysis shows that part of the fluctuations in macrozoobenthic biomass stocks during the last decades is related to the effect of the coastal defense infrastructures on the basin morphology and hydrodynamics. The methodological framework we propose is particularly suitable for the analysis of large abundance datasets combined with high-resolution environmental data. Our analysis provides useful information on future changes in ecosystem functionality induced by human activities.


Conflict of interest statement

Competing Interests: The authors have declared that no competing interests exist.

Figures

Figure 1
Figure 1. The Oosterschelde basin.
In the boxes are reported the name and the realization date of the major dikes.
Figure 2
Figure 2. Models validation. Ratio between observed and predicted values.
To validate our forecast for each of the modeled quantiles, the whole dataset was sampled with replacement. Due to sampling with replacement, some observations are repeated and others remain unpicked. The model was fitted on the sampled observation (training dataset) and used to predict the unpicked ones (validation dataset). The random sampling-fitting-predicting procedure was iterated 5000 times and repeated for each one of the forecast quantiles. To make predicted (quantiles) and realized values comparable each other, we discretized them in 10 homogeneous classes based on the predicted values. For each of the classes, the correspondent sample quantile of the observed data was calculated. To finally asses the validity of the model, observed and predicted quantiles were plotted against each other and checked for linear correlation. The four quantiles for species showed as examples in the graphs were selected among those predicting occurrence (e.g., up to the 35th quantile for S. armiger, up to the 78th quantile for L. conchilega Table 4). The other quantiles generally follow the same trends. The black broken line represent the 1∶1 ratio.
Figure 3
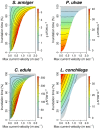
Figure 3. Models of the 0.975th quantile, response surfaces.
Models of the maximal biomass, when extrapolated in the explanatory variable space, give a description of the species potential niche consistent with the Liebig's Law.
Figure 4
Figure 4. Median values of the explanatory variables on different year-scenarios.
Circles represent the median values predicted for the available years-scenarios by the hydrodynamic model. Triangles represent the values predicted for the years 2010 and 2100 removing the Delta Works (NDW).
Figure 5
Figure 5. Models of the 0.975th quantile, habitat suitability.
Once extrapolated to realistic scenarios, the response surface shown in 3 are useful to produce clearly interpretable habitat suitability maps. In the figure we show as example the output for the 1968, 2010 and 2100 scenarios.
Figure 6
Figure 6. Complete distribution model vs Model of the maxima.
Example for C. edule, year 2010. Map produced by sampling from the complete quantile distribution models (A) are able to represent the realistic scatter around (mainly below) the response surface shown in (B). To help the reader in appreciating the fine mosaic of points in (A) we restricted the map to a smaller portion of the basin and we used a logarithmic scale for plotting the estimated values.
Figure 7
Figure 7. Biomass standing stocks, time series.
Colored bar show the intertidal (green) and subtidal (blue) realized biomass stock estimated from the different scenarios for the present extension of the basin. Broken-line bars on the years 1968 and 1983 include the area that was cut-off from the beginning of the Oesterdam works in 1979 (25 km2 between 1968 and 1983 and 12 km2 between 1983 and 1986). Empty bars on the years 2010 and 2100 show the result of the scenarios simulated removing the Delta Works.
Figure 8
Figure 8. Potential vs Realized stocks.
The graphs show the ratio between potential (formula image = 0.975) and realized (sampling from the complete cumulative distribution) intertidal (green) and subtidal (blue) biomass stocks estimated for different year/scenarios. The black dotted line represent the 1∶5 ratio. The black broken line represent the 1∶10 ratio.

Similar articles

Cited by

References

    1. Parmesan C (2006) Ecological and evolutionary responses to recent climate change. Annual Review of Ecology Evolution and Systematics 37: 637–669.
    1. Costanza R, d'Arge R, deGroot R, Farber S, Grasso M, et al. (1997) The value of the world's ecosystem services and natural capital. Nature 387: 253–260.
    1. Syfert MM, Smith MJ, Coomes DA (2013) The Effects of Sampling Bias and Model Complexity on the Predictive Performance of MaxEnt Species Distribution Models. PLOS ONE 8. - PMC - PubMed
    1. Araujo M, Guisan A (2006) Five (or so) challenges for species distribution modelling. Journal of Biogeography 33: 1677–1688.
    1. Kamino LHY, Stehmann JR, Amaral S, De Marco P Jr, Rangel TF, et al. (2012) Challenges and perspectives for species distribution modelling in the neotropics. Biology Letters 8: 324–326. - PMC - PubMed

Publication types

LinkOut - more resources