Postsynaptic odorant concentration dependent inhibition controls temporal properties of spike responses of projection neurons in the moth antennal lobe
- PMID: 24586546
- PMCID: PMC3929629
- DOI: 10.1371/journal.pone.0089132
Postsynaptic odorant concentration dependent inhibition controls temporal properties of spike responses of projection neurons in the moth antennal lobe
Abstract
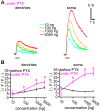
Although odorant concentration-response characteristics of olfactory neurons have been widely investigated in a variety of animal species, the effect of odorant concentration on neural processing at circuit level is still poorly understood. Using calcium imaging in the silkmoth (Bombyx mori) pheromone processing circuit of the antennal lobe (AL), we studied the effect of odorant concentration on second-order projection neuron (PN) responses. While PN calcium responses of dendrites showed monotonic increases with odorant concentration, calcium responses of somata showed decreased responses at higher odorant concentrations due to postsynaptic inhibition. Simultaneous calcium imaging and electrophysiology revealed that calcium responses of PN somata but not dendrites reflect spiking activity. Inhibition shortened spike response duration rather than decreasing peak instantaneous spike frequency (ISF). Local interneurons (LNs) that were specifically activated at high odorant concentrations at which PN responses were suppressed are the putative source of inhibition. Our results imply the existence of an intraglomerular mechanism that preserves time resolution in olfactory processing over a wide odorant concentration range.
Conflict of interest statement
Figures


Similar articles
-
Task-specific roles of local interneurons for inter- and intraglomerular signaling in the insect antennal lobe.Elife. 2021 Sep 23;10:e65217. doi: 10.7554/eLife.65217. Elife. 2021. PMID: 34554087 Free PMC article.
-
Odorant concentration differentiator for intermittent olfactory signals.J Neurosci. 2014 Dec 10;34(50):16581-93. doi: 10.1523/JNEUROSCI.2319-14.2014. J Neurosci. 2014. PMID: 25505311 Free PMC article.
-
Plasticity of recurrent inhibition in the Drosophila antennal lobe.J Neurosci. 2012 May 23;32(21):7225-31. doi: 10.1523/JNEUROSCI.1099-12.2012. J Neurosci. 2012. PMID: 22623667 Free PMC article.
-
Glomerular interactions in olfactory processing channels of the antennal lobes.J Comp Physiol A Neuroethol Sens Neural Behav Physiol. 2013 Nov;199(11):929-46. doi: 10.1007/s00359-013-0842-6. Epub 2013 Jul 28. J Comp Physiol A Neuroethol Sens Neural Behav Physiol. 2013. PMID: 23893248 Free PMC article. Review.
-
Elements of olfactory reception in adult Drosophila melanogaster.Anat Rec (Hoboken). 2013 Sep;296(9):1477-88. doi: 10.1002/ar.22747. Epub 2013 Jul 31. Anat Rec (Hoboken). 2013. PMID: 23904114 Review.
Cited by
-
Fat Body Organ Culture System in Aedes Aegypti, a Vector of Zika Virus.J Vis Exp. 2017 Aug 19;(126):55508. doi: 10.3791/55508. J Vis Exp. 2017. PMID: 28872112 Free PMC article.
-
Odor processing in the cockroach antennal lobe-the network components.Cell Tissue Res. 2021 Jan;383(1):59-73. doi: 10.1007/s00441-020-03387-3. Epub 2021 Jan 23. Cell Tissue Res. 2021. PMID: 33486607 Free PMC article. Review.
-
Geosmin suppresses defensive behaviour and elicits unusual neural responses in honey bees.Sci Rep. 2023 Mar 8;13(1):3851. doi: 10.1038/s41598-023-30796-5. Sci Rep. 2023. PMID: 36890201 Free PMC article.
-
Establishment of tools for neurogenetic analysis of sexual behavior in the silkmoth, Bombyx mori.PLoS One. 2014 Nov 14;9(11):e113156. doi: 10.1371/journal.pone.0113156. eCollection 2014. PLoS One. 2014. PMID: 25396742 Free PMC article.
-
Task-specific roles of local interneurons for inter- and intraglomerular signaling in the insect antennal lobe.Elife. 2021 Sep 23;10:e65217. doi: 10.7554/eLife.65217. Elife. 2021. PMID: 34554087 Free PMC article.
References
-
- Hallem EA, Dahanukar A, Carlson JR (2006) Insect odor and taste receptors. Annu Rev Entomol 51: 113–135. - PubMed
-
- Wang JW, Wong AM, Flores J, Vosshall LB, Axel R (2003) Two photon calcium imaging reveals an odor evoked map of activity in the fly brain. Cell 112: 271–282. - PubMed
-
- Friedrich RW, Korsching SI (1997) Combinatorial and chemotopic odorant coding in the zebrafish olfactory bulb visualized by optical imaging. Neuron 18: 737–752. - PubMed
-
- Imamura K, Mataga N, Mori K (1992) Coding of odor molecules by mitral tufted cells in rabbit olfactory bulb. I. Aliphatic compounds. J Neurophysiol 68: 1986–2002. - PubMed
Publication types
MeSH terms
Substances
LinkOut - more resources
Full Text Sources
Other Literature Sources

