. 2014 Feb 25;9(2):e89158.
doi: 10.1371/journal.pone.0089158. eCollection 2014.

Normalization of RNA-sequencing data from samples with varying mRNA levels

Affiliations

Normalization of RNA-sequencing data from samples with varying mRNA levels

Håvard Aanes et al. PLoS One. .

Abstract

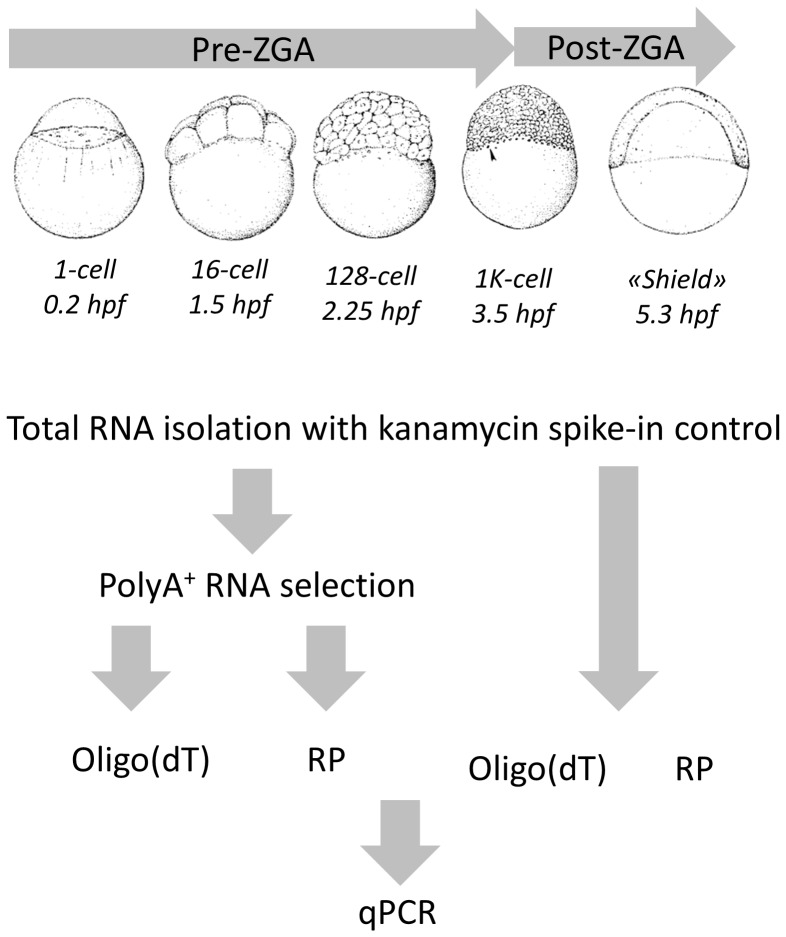
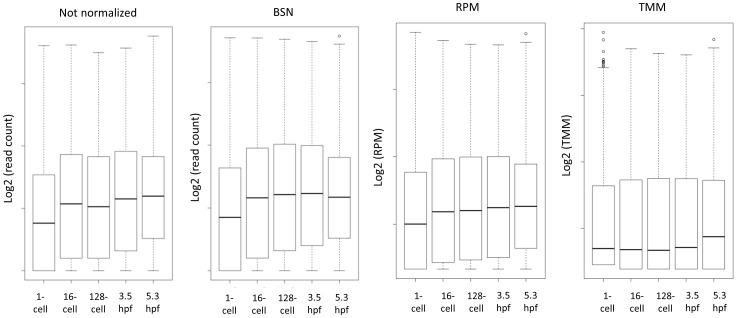
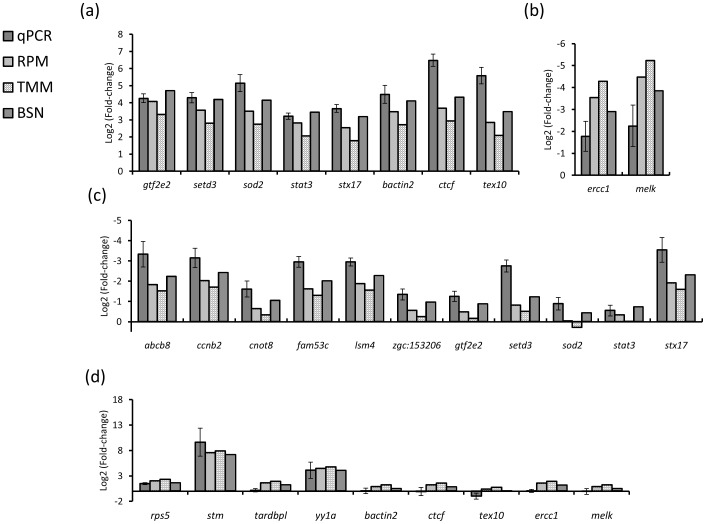
Methods for normalization of RNA-sequencing gene expression data commonly assume equal total expression between compared samples. In contrast, scenarios of global gene expression shifts are many and increasing. Here we compare the performance of three normalization methods when polyA(+) RNA content fluctuates significantly during zebrafish early developmental stages. As a benchmark we have used reverse transcription-quantitative PCR. The results show that reads per kilobase per million (RPKM) and trimmed mean of M-values (TMM) normalization systematically leads to biased gene expression estimates. Biological scaling normalization (BSN), designed to handle differences in total expression, showed improved accuracy compared to the two other methods in estimating transcript level dynamics. The results have implications for past and future studies using RNA-sequencing on samples with different levels of total or polyA(+) RNA.


Conflict of interest statement

Competing Interests: The authors have declared that no competing interests exist.

Figures

Figure 1
Figure 1. Experimental design.
Total RNA from 5 developmental stages pre- and post-ZGA was isolated and kanamycin polyA+ RNA was used to adjust for differences in RNA yield. PolyA+ RNA was isolated and four cDNA libraries were generated to compare qPCR results using different template and primers.
Figure 2
Figure 2. Relative polyA+ RNA amounts.
Measurements of polyA+ RNA determined by a standard laboratory method (full line) and using trimmed mean of M-values (TMM) (stippled line) display an almost identical pattern during early embryogenesis with an early increase and subsequent decrease. The levels are relative to the 1-cell stage.
Figure 3
Figure 3. cDNA template and primer comparison.
Comparison of RT-qPCR results based on polyA+ and total RNA and oligo(dT) and random primers for stat3. The increase pre-ZGA is only detected in the polyA+ RNA-based cDNA libraries. PolyA  =  polyA+ RNA, Total  =  total RNA, OdT  =  oligo(dT) primers, RP  =  random primers.
Figure 4
Figure 4. Distribution of gene expression values.
Box plot of distribution of transcript counts or values before (not normalized) and after normalization (BSN, RPM and TMM).
Figure 5
Figure 5. Comparison of normalization methods.
Log2-tranformed fold-changes comparing RT-qPCR and RNA-seq data normalized using RPM, TMM and BSN for transcripts increasing pre-ZGA (a), decreasing pre-ZGA (b), decreasing post-ZGA (c) and increasing post-ZGA (d).

References

    1. Jiang L, Schlesinger F, Davis CA, Zhang Y, Li R, et al. (2011) Synthetic spike-in standards for RNA-seq experiments. Genome Res 21: 1543–1551 gr.121095.111 [pii];10.1101/gr.121095.111 [doi]. - PMC - PubMed
    1. Dillies MA, Rau A, Aubert J, Hennequet-Antier C, Jeanmougin M, et al. (2012) A comprehensive evaluation of normalization methods for Illumina high-throughput RNA sequencing data analysis. Brief Bioinform. bbs046 [pii];10.1093/bib/bbs046 [doi]. - PubMed
    1. Meyer SU, Pfaffl MW, Ulbrich SE (2010) Normalization strategies for microRNA profiling experiments: a ‘normal’ way to a hidden layer of complexity? Biotechnol Lett 32: 1777–1788 10.1007/s10529-010-0380-z [doi]. - DOI - PubMed
    1. Mortazavi A, Williams BA, McCue K, Schaeffer L, Wold B (2008) Mapping and quantifying mammalian transcriptomes by RNA-Seq. Nat Methods 5: 621–628 nmeth.1226 [pii];10.1038/nmeth.1226 [doi]. - PubMed
    1. Robinson MD, Oshlack A (2010) A scaling normalization method for differential expression analysis of RNA-seq data. Genome Biol 11: R25 gb-2010-11-3-r25 [pii];10.1186/gb-2010-11-3-r25 [doi]. - PMC - PubMed

Publication types

MeSH terms