. 2014 Feb 20;9(2):e89175.
doi: 10.1371/journal.pone.0089175. eCollection 2014.

Effect of bodily fluids from honey bee (Apis mellifera) larvae on growth and genome-wide transcriptional response of the causal agent of American Foulbrood disease (Paenibacillus larvae)

Affiliations

Effect of bodily fluids from honey bee (Apis mellifera) larvae on growth and genome-wide transcriptional response of the causal agent of American Foulbrood disease (Paenibacillus larvae)

Lina De Smet et al. PLoS One. .

Abstract

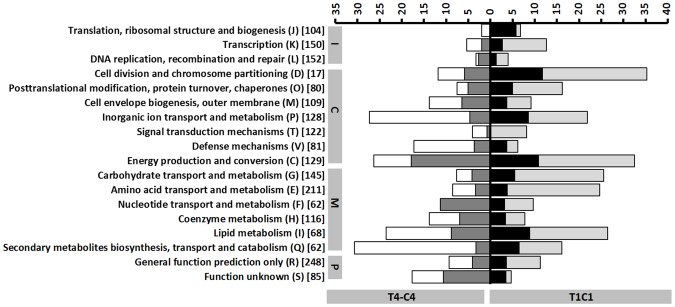
Paenibacillus larvae, the causal agent of American Foulbrood disease (AFB), affects honey bee health worldwide. The present study investigates the effect of bodily fluids from honey bee larvae on growth velocity and transcription for this Gram-positive, endospore-forming bacterium. It was observed that larval fluids accelerate the growth and lead to higher bacterial densities during stationary phase. The genome-wide transcriptional response of in vitro cultures of P. larvae to larval fluids was studied by microarray technology. Early responses of P. larvae to larval fluids are characterized by a general down-regulation of oligopeptide and sugar transporter genes, as well as by amino acid and carbohydrate metabolic genes, among others. Late responses are dominated by general down-regulation of sporulation genes and up-regulation of phage-related genes. A theoretical mechanism of carbon catabolite repression is discussed.


Conflict of interest statement

Competing Interests: The authors have declared that no competing interests exist.

Figures

Figure 1
Figure 1. Effect of honey bee larval bodily fluid on Paenibacillus larvae growth.
Effect of different concentrations of honey bee larval bodily fluid on the in vitro growth of P. larvae bacterial cells, expressed as the optical density measured at a wavelength of 590 nm (OD590) in function of time (hours). Growth alterations were determined for six bodily fluid concentrations, expressed as the fold dilution in BHIT broth cultures: 10× dilution (♦), 25× dilution (▪), 50× dilution (▴), 100× dilution (⋄), 250× dilution (□), 500× dilution (▵), control (○). Each point in the graph displays the mean of three independent replicates, with the error bars being the standard deviations. Time 0 represents the time of spiking. Trend lines are calculated with DMfit. No OD measurements were performed during lag phase.
Figure 2
Figure 2. Effect of honey bee larval bodily fluid on Paenibacillus larvae bacterial density.
OD590 (white bars) and CFU/ml (black bars) for T1, C1, T4 and C4. T1 (n = 12): test sample collected one hour after spiking with 5% larval fluids. T4 (n = 12): test sample collected four hours after spiking with 5% larval fluids. C1 (n = 11): control sample collected one hour after spiking with BHIT-broth. C4 (n = 12): control sample collected four hours after spiking with BHIT-broth. Between brackets (n): number of independent replicates. Error bars: standard deviations.
Figure 3
Figure 3. Differential expression of transporter encoding genes.
Stacked percentage bar chart, showing the numbers of up- and down-regulated (putative) transporter encoding genes for T4-C4 (left) and T1-C1 (right), respectively, relative to the total numbers of (putative) transporter encoding genes within the P. larvae genome. The latter are indicated between square brackets. Round brackets: GO term numbers. GO terms were assigned with Blast2GO. White bars: down-regulation for T4-C4. Dark grey bars: up-regulation for T4-C4. Light grey bars: down-regulation for T1-C1. Black bars: up-regulation for T1-C1. Arrow heads: arbitrary GO term hierarchy (◂>⊲><$>\raster(90%)="rg3"<$>).
Figure 4
Figure 4. Differential expression of metabolic genes.
Stacked percentage bar chart, showing the numbers of up- and down-regulated (putative) metabolic genes for T4-C4 (left) and T1-C1 (right), respectively, relative to the total numbers of (putative) metabolic genes within the P. larvae genome. C: carbohydrate metabolism. The latter are indicated between square brackets. Round brackets: KO numbers (KEGG pathways). KEGG pathways were assigned with KAAS. White bars: down-regulation for T4-C4. Dark grey bars: up-regulation for T4-C4. Light grey bars: down-regulation for T1-C1. Black bars: up-regulation for T1-C1. E: energy metabolism. L: lipid metabolism. N: nucleotide metabolism. A: amino acid metabolism. ∼: KO:00061; KO:00071; KO:00592; KO:01040. *: KO:00360; KO:00350; KO:00380. °: KO:00410; KO:00430; KO:00450; KO:00460; KO:00480. ?: KO:00740; KO:00770; KO:00780; KO:00670; KO:00860; KO:00130. ‘:KO:00900; KO:00903; KO:00281; KO:00523; KO:01053; KO:01055; KO:00940; KO:00311; KO:00521. ‘’: KO:00362; KO:00627; KO:00625; KO:00622; KO:00633; KO:00642; KO:00643; KO:00930; KO:00363; KO:00621; KO:00626.
Figure 5
Figure 5. Numbers of genes that are differentially expressed per subset.
Stacked percentage bar chart, showing the numbers of up- and down-regulated genes for T4-C4 (left) and T1-C1 (right), respectively, relative to the total numbers of genes within the P. larvae genome. The latter are indicated between square brackets. Round brackets: COG functional category label. C: cellular processes and signaling. I: information storage and processing. M: metabolism. P: poorly characterized. White bars: down-regulation for T4-C4. Dark grey bars: up-regulation for T4-C4. Light grey bars: down-regulation for T1-C1. Black bars: up-regulation for T1-C1.

References

    1. Ellis JD, Munn PA (2005) The worldwide health status of honey bees. Bee World 86: 88–101.
    1. Crailsheim K, Riessberger-Galle U (2001) Honey bee age-dependent resistance against American foulbrood. Apidologie 32: 91–103.
    1. Brødsgaard CJ, Ritter W, Hansen H (1998) Response of in vitro reared honey bee larvae to various doses of Paenibacillus larvae larvae spores. Apidologie 29: 569–578.
    1. Yue D, Nordhoff M, Wieler LH, Genersch E (2008) Fluorescence in situ hybridization (FISH) analysis of the interactions between honey bee larvae and Paenibacillus larvae, the causative agent of American foulbrood of honey bees (Apis mellifera). Environ Microbiol 10: 1612–1620. - PubMed
    1. Sturtevant AP (1932) Relation of commercial honey to the spread of American foulbrood. J Agricul Res 45: 257–285.

Publication types

Substances