

Transcription factor binding sites prediction based on modified nucleosomes
- PMID: 24586611
- PMCID: PMC3931712
- DOI: 10.1371/journal.pone.0089226
Transcription factor binding sites prediction based on modified nucleosomes
Abstract
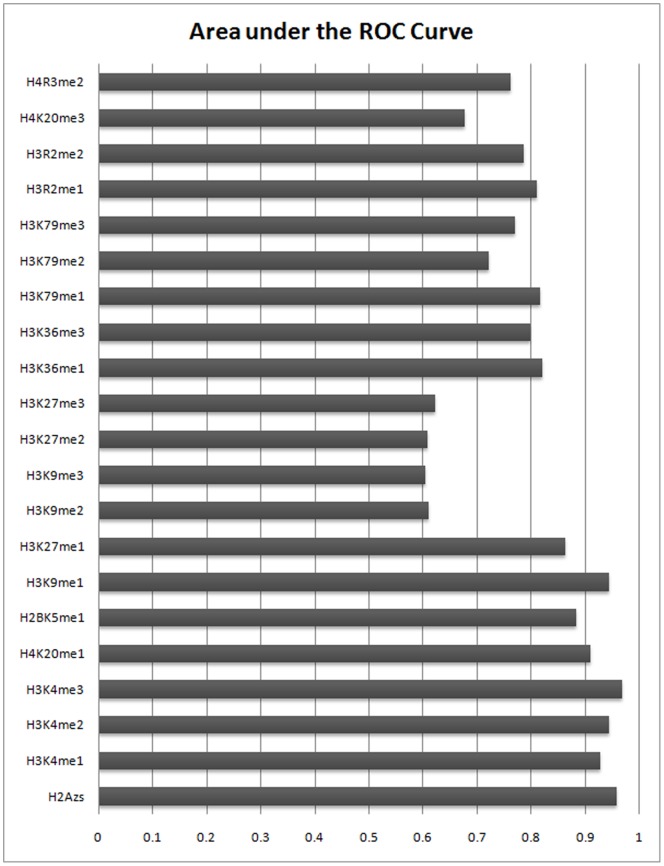
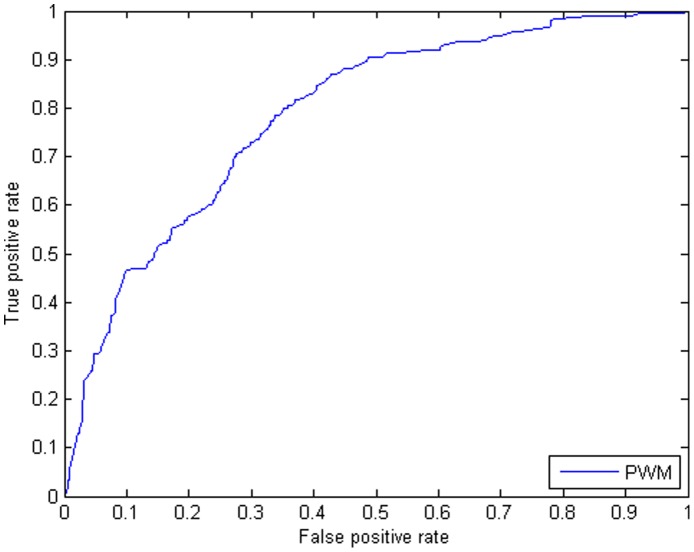
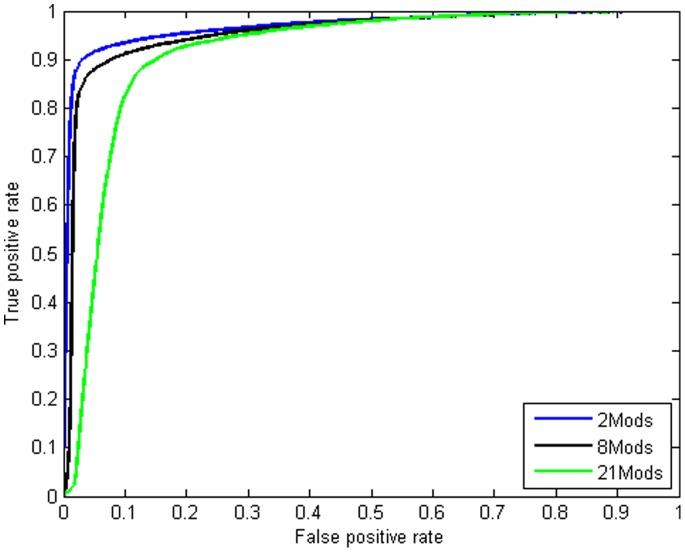
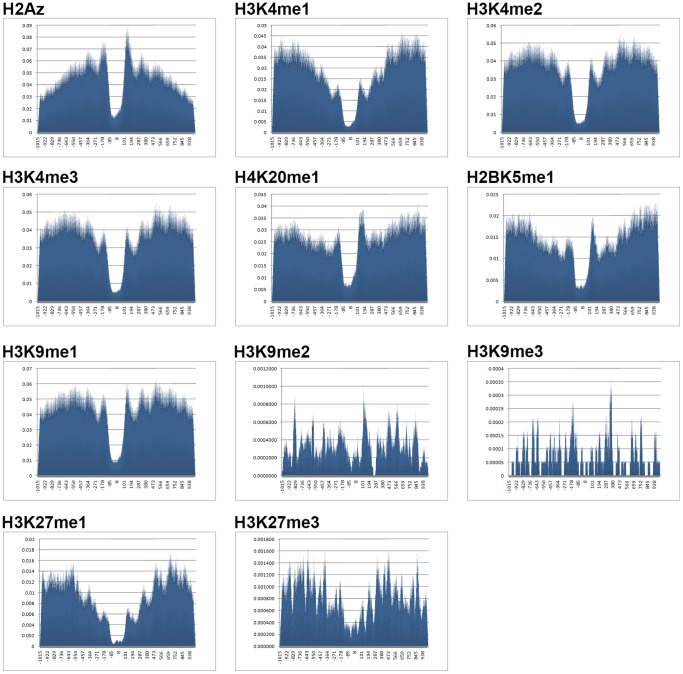
In computational methods, position weight matrices (PWMs) are commonly applied for transcription factor binding site (TFBS) prediction. Although these matrices are more accurate than simple consensus sequences to predict actual binding sites, they usually produce a large number of false positive (FP) predictions and so are impoverished sources of information. Several studies have employed additional sources of information such as sequence conservation or the vicinity to transcription start sites to distinguish true binding regions from random ones. Recently, the spatial distribution of modified nucleosomes has been shown to be associated with different promoter architectures. These aligned patterns can facilitate DNA accessibility for transcription factors. We hypothesize that using data from these aligned and periodic patterns can improve the performance of binding region prediction. In this study, we propose two effective features, "modified nucleosomes neighboring" and "modified nucleosomes occupancy", to decrease FP in binding site discovery. Based on these features, we designed a logistic regression classifier which estimates the probability of a region as a TFBS. Our model learned each feature based on Sp1 binding sites on Chromosome 1 and was tested on the other chromosomes in human CD4+T cells. In this work, we investigated 21 histone modifications and found that only 8 out of 21 marks are strongly correlated with transcription factor binding regions. To prove that these features are not specific to Sp1, we combined the logistic regression classifier with the PWM, and created a new model to search TFBSs on the genome. We tested the model using transcription factors MAZ, PU.1 and ELF1 and compared the results to those using only the PWM. The results show that our model can predict Transcription factor binding regions more successfully. The relative simplicity of the model and capability of integrating other features make it a superior method for TFBS prediction.
Conflict of interest statement
Figures
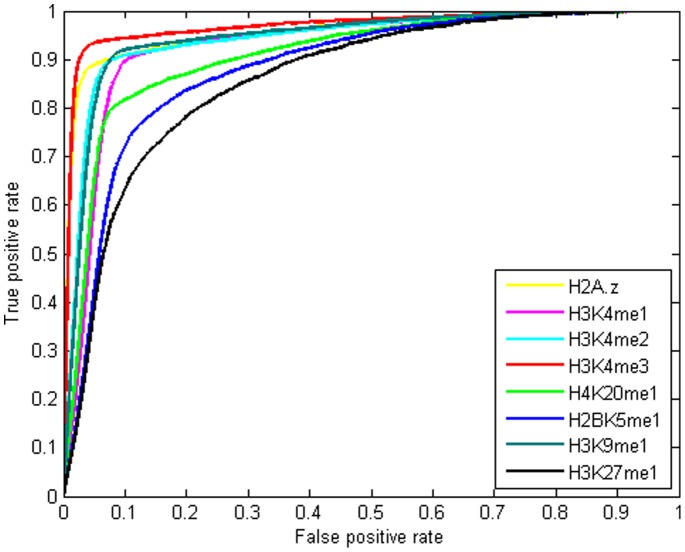
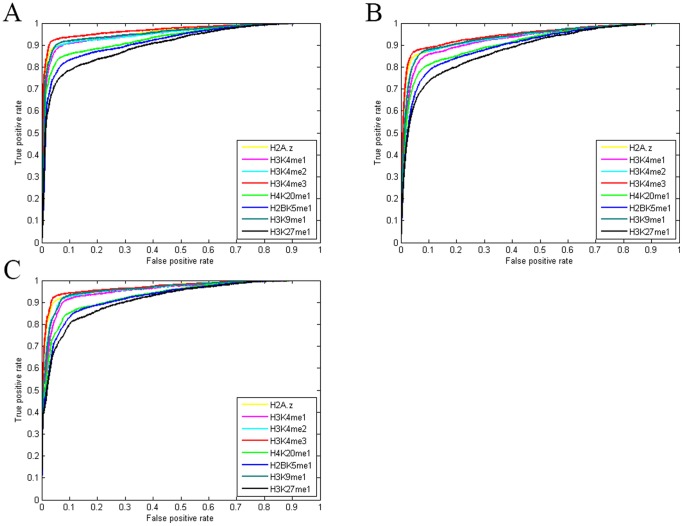
 as introduced in the Methods. ROC curves for the rest of the 13 modifications can be found in Figure S3. Comparing this figure with Figure S4, S5, S6 clearly demonstrate the usefulness of the MNN feature for prediction of binding locations.
Similar articles
-
Nucleosome organization in the vicinity of transcription factor binding sites in the human genome.BMC Genomics. 2014 Jun 19;15(1):493. doi: 10.1186/1471-2164-15-493. BMC Genomics. 2014. PMID: 24942981 Free PMC article.
-
Low nucleosome occupancy is encoded around functional human transcription factor binding sites.BMC Genomics. 2008 Jul 15;9:332. doi: 10.1186/1471-2164-9-332. BMC Genomics. 2008. PMID: 18627598 Free PMC article.
-
Integrating genomic data to predict transcription factor binding.Genome Inform. 2005;16(1):83-94. Genome Inform. 2005. PMID: 16362910
-
[Advances on bioinformatic research in transcription factor binding sites].Yi Chuan. 2009 Apr;31(4):365-73. doi: 10.3724/sp.j.1005.2009.00365. Yi Chuan. 2009. PMID: 19586888 Review. Chinese.
-
Computational framework for the prediction of transcription factor binding sites by multiple data integration.BMC Neurosci. 2006 Oct 30;7 Suppl 1(Suppl 1):S8. doi: 10.1186/1471-2202-7-S1-S8. BMC Neurosci. 2006. PMID: 17118162 Free PMC article. Review.
Cited by
-
Cross-Cell-Type Prediction of TF-Binding Site by Integrating Convolutional Neural Network and Adversarial Network.Int J Mol Sci. 2019 Jul 12;20(14):3425. doi: 10.3390/ijms20143425. Int J Mol Sci. 2019. PMID: 31336830 Free PMC article.
-
Discovering human transcription factor physical interactions with genetic variants, novel DNA motifs, and repetitive elements using enhanced yeast one-hybrid assays.Genome Res. 2019 Sep;29(9):1533-1544. doi: 10.1101/gr.248823.119. Genome Res. 2019. PMID: 31481462 Free PMC article.
-
A post-GWAS confirming the genetic effects and functional polymorphisms of AGPAT3 gene on milk fatty acids in dairy cattle.J Anim Sci Biotechnol. 2021 Feb 1;12(1):24. doi: 10.1186/s40104-020-00540-4. J Anim Sci Biotechnol. 2021. PMID: 33522959 Free PMC article.
-
Contribution of Sequence Motif, Chromatin State, and DNA Structure Features to Predictive Models of Transcription Factor Binding in Yeast.PLoS Comput Biol. 2015 Aug 20;11(8):e1004418. doi: 10.1371/journal.pcbi.1004418. eCollection 2015 Aug. PLoS Comput Biol. 2015. PMID: 26291518 Free PMC article.
-
A comprehensive review of computational prediction of genome-wide features.Brief Bioinform. 2020 Jan 17;21(1):120-134. doi: 10.1093/bib/bby110. Brief Bioinform. 2020. PMID: 30462144 Free PMC article.
References
-
- Holloway DT, Kon M, DeLisi C (2005) Integrating genomic data to predict transcription factor binding. Genome Informatics Series 16: 83. - PubMed
MeSH terms
Substances
LinkOut - more resources
Full Text Sources
Other Literature Sources
Research Materials
