. 2014 Feb 20;9(2):e89377.
doi: 10.1371/journal.pone.0089377. eCollection 2014.

In vivo generation of immature inner hair cells in neonatal mouse cochleae by ectopic Atoh1 expression

Affiliations

In vivo generation of immature inner hair cells in neonatal mouse cochleae by ectopic Atoh1 expression

Zhiyong Liu et al. PLoS One. .

Abstract

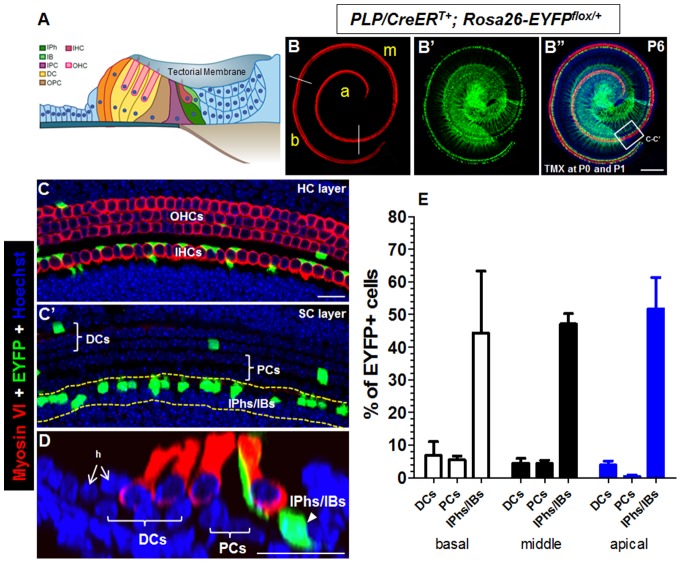
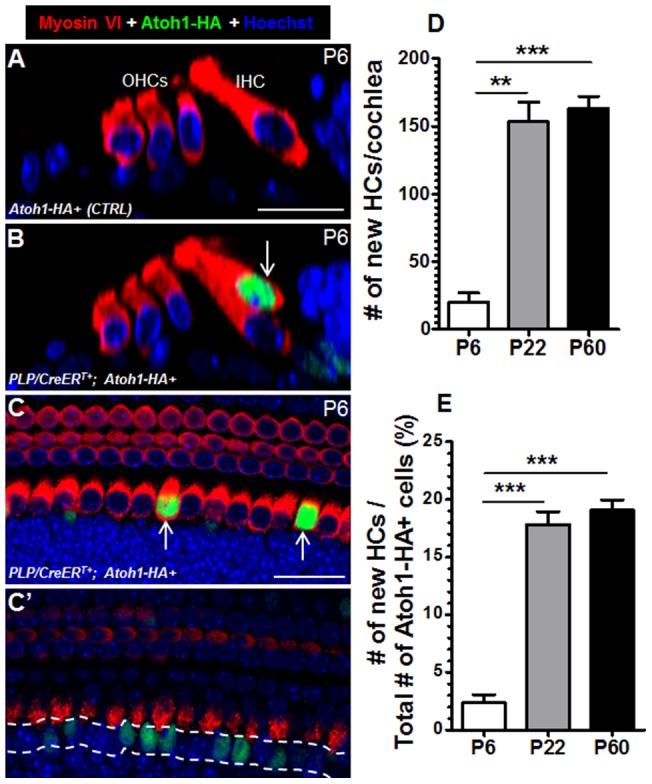
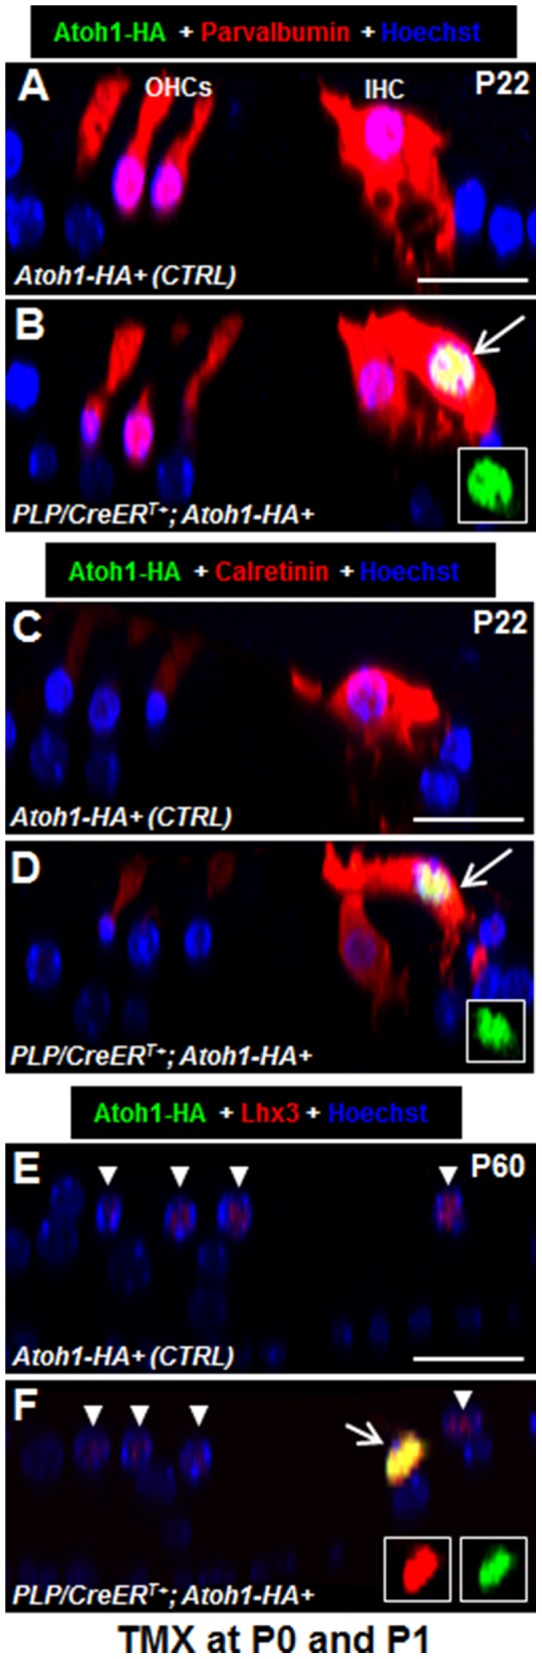
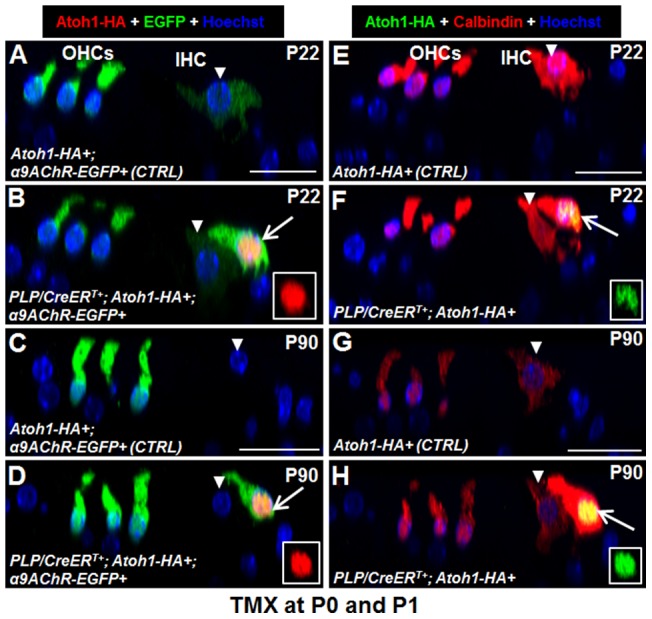
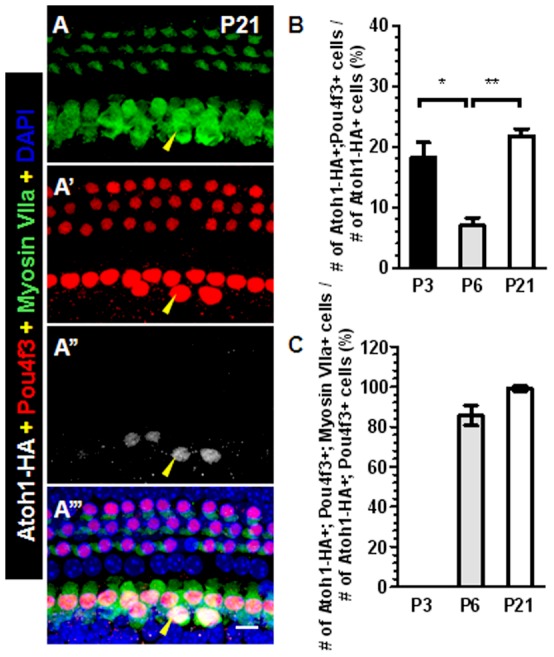
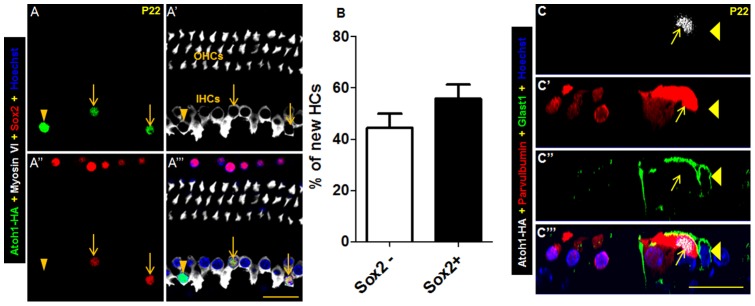
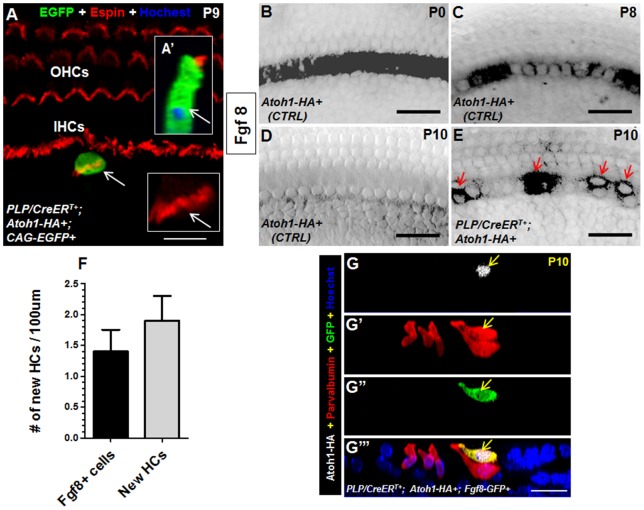
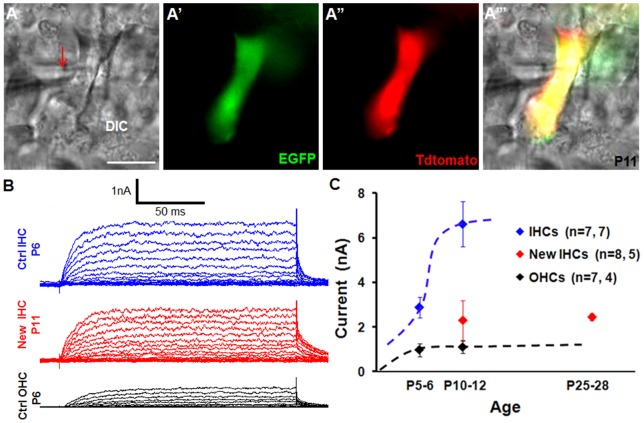
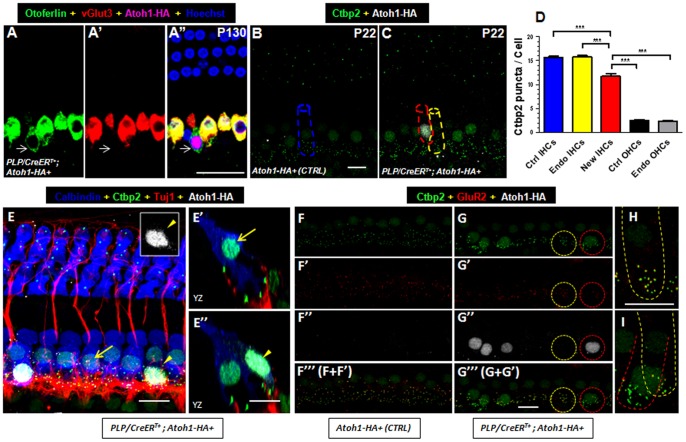
Regeneration of auditory hair cells (HCs) is a promising approach to restore hearing. Recent studies have demonstrated that induced pluripotent stem cells/embryonic stem cells or supporting cells (SCs) adjacent to HCs can be converted to adopt the HC fate. However, little is known about whether new HCs are characteristic of outer or inner HCs. Here, we showed in vivo conversion of 2 subtypes of SCs, inner border cells (IBs) and inner phalangeal cells (IPhs), to the inner HC (IHC) fate. This was achieved by ectopically activating Atoh1, a transcription factor necessary for HC fate, in IBs/IPhs at birth. Atoh1+ IBs/IPhs first turned on Pou4f3, another HC transcription factor, before expressing 8 HC markers. The conversion rate gradually increased from ∼ 2.4% at 1 week of age to ∼ 17.8% in adult. Interestingly, new HCs exhibited IHC characteristics such as straight line-shaped stereociliary bundles, expression of Fgf8 and otoferlin, and presence of larger outward currents than those of outer HCs. However, new HCs lacked the terminal differentiation IHC marker vGlut3, exhibited reduced density of presynaptic Cbtp2 puncta that had little postsynaptic GluR2 specialization, and displayed immature IHC outward currents. Our results demonstrate that the conversion rate of IBs/IPhs in vivo by Atoh1 ectopic expression into the IHC fate was higher and faster and the conversion was more complete than that of the 2 other SC subtypes underneath the outer HCs; however, these new IHCs are arrested before terminal differentiation. Thus, IBs/IPhs are good candidates to regenerate IHCs in vivo.


Conflict of interest statement

Competing Interests: The authors have declared that no competing interests exist.

Figures

Figure 1
Figure 1. Characterization of Cre activity in PLP/CreERT+; Rosa26-EYFPflox/+ mice.
(A) Scheme of the neonatal mouse organ of Corti. (B–B’’) Whole-mount double staining of Myosin VI and EYFP. Cochleae were dissected from PLP/CreERT+; Rosa26-EYFPflox/+ mice given tamoxifen at P0 and P1 and analyzed at P6. (C–C') High-magnification images of the area within the square in (B’’) at the HC layer (C) and the SC layer (C'). (D) Confocal optical image of the cochlear sample that was double labeled with Myosin VI and EYFP. (E) Percentage of EYFP+ populations among different SC subtypes. b: basal turn; m: middle turn; a: apical turn. h: Hensen's cells; DCs: Deiters' cells; PCs: pillar cells; OPC: Outer Pillar Cell; IPC: Inner Pillar Cell; IBs/IPhs: inner border cells/inner phalangeal cells. Scale bars: 200 µm (B’’); 20 µm (C–D).
Figure 2
Figure 2. Conversion of neonatal IBs/IPhs into HCs by ectopic Atoh1-HA expression.
(A–B) Optical images from the colabeling of Myosin VI and Atoh1-HA in the cochleae of control (A) and PLP/CreERT+; Atoh1-HA+ mice (B) at P6. The arrow in (B) points to a new HC. (C–C') A whole-mount confocal image taken at the HC layer (C) and the IBs/IPhs layer (C') from a PLP/CreERT+; Atoh1-HA+ cochlea at P6. Many Atoh1-HA+ IBs/IPhs (green cells within the dashed line) did not turn on Myosin VI. (D) Quantification of the total new HCs based on Atoh1-HA and Myosin VI co-expression in the entire cochleae at P6, P22, and P60 (**P<0.01, ***P<0.001, n = 3). (E) The reprogramming efficiency was calculated by normalizing the new HCs to the total Atoh1-HA+ IBs/IPhs/new HCs at P6, P22, and P60 (***P<0.001, n = 3). Scale bar: 20 µm.
Figure 3
Figure 3. New HCs express HC markers.
(A–B) Optical confocal image of Atoh1-HA and parvalbumin costaining in control (A) and PLP/CreERT+; Atoh1-HA+ (B) mice at P22. (C–D) Optical confocal image of Atoh1-HA and calretinin costaining in control (C) and PLP/CreERT+; Atoh1-HA+ (D) mice at P22. (E–F) Optical confocal image of Atoh1-HA and Lhx3 costaining in control (E) and PLP/CreERT+; Atoh1-HA+ (F) mice at P60. Arrows in (B), (D), and (F) point to new HCs. The inset in (B), (D), and (F) shows a single-channel signal for Atoh1-HA and/or Lhx3. Arrow heads in (E) and (F) represent endogenous OHCs and IHCs. OHCs: outer hair cells; IHC: inner hair cell. Scale bar: 20 µm.
Figure 4
Figure 4. New IHCs cannot downregulate α9AChR and calbindin at older ages.
(A–D) Double staining of Atoh1-HA and EGFP in control (A, C) and PLP/CreERT+; Atoh1-HA+; α9AChR-EGFP+ (B, D) mice at P22 (A, B) and P90 (C, D). (E–H) Colabeling of Atoh1-HA and calbindin in control (E, G) and PLP/CreERT+; Atoh1-HA+ (F, H) mice at P22 (E, F) and P90 (G, H). Arrows in (B), (D), (F), and (H) represent new IHCs. The inset in (B), (D), (F), and (H) shows a single-channel signal for Atoh1-HA. Arrow heads in (A–H) represent endogenous IHCs. OHCs: outer hair cells; IHC: inner hair cell. Scale bar: 20 µm.
Figure 5
Figure 5. Pou4f3 is expressed, prior to other HC markers, in the new HCs.
(A–A’’’) Triple staining image of Myosin VIIa, Pou4f3 and Atoh1-HA in cochlea of PLP/CreERT+; Atoh1-HA+ mice. Arrowheads in (A-A’’’) point to a new HC expressing Atoh1-HA, Pou4f3 and Myosin VIIa. (B) Percentages of Atoh1-HA+/Pou4f3+ cells among total Atoh1-HA+ cells at various ages. * p<0.05 (n = 3), ** p<0.01 (n = 3). (C) Percentages of Atoh1-HA+/Pou4f3+/Myosin VIIa+ new HCs among total Atoh1-HA+/Pou4f3+ cells at various ages. Note that Pou4f3 is expressed in ∼20% Atoh1-HA+ cells at P3 prior to Myosin VII expression and that at P6 and P21, there were Atoh1-HA+/Pou4f3+ cells that had yet to express Myosin VII. Scale bar: 10 µm.
Figure 6
Figure 6. Heterogeneous Sox2 expression and absence of Glast1 in new HCs.
(A–A’’’) Whole-mount triple staining of Atoh1-HA, myosin VI, and Sox2 in cochleae of PLP/CreERT+; Atoh1-HA+ mice at P22. Arrows point to new HCs that maintained Sox2 expression. The arrowhead represents the new HC without Sox2 expression. (B) Percentages of Sox2-positive and Sox2-negative new HCs. OHCs: outer hair cells; IHC: inner hair cell. (C–C’’’) Triple staining of Atoh1-HA, parvalbumin, and Glast1 in cochleae of PLP/CreERT+; Atoh1-HA+ mice at P22. Arrows show the new HC that did not express Glast1. Arrowheads point to a Glast1+ IB/IPh cell that wraps the new HC. There was no overlap of parvalbumin and Glast1 signals at the top of the new HC membrane. Scale bar: 20 µm.
Figure 7
Figure 7. New HCs adopt the IHC fate.
(A–A') Confocal image of EGFP and Espin double staining at the top of the HC layer. Cochleae were dissected from PLP/CreERT+; Atoh1-HA+; CAG-EGFP+ mice given tamoxifen at P0 and P1 and analyzed at P9. Arrows show the same new HC with the straight line–shaped stereociliary bundles. (A') The same new HC viewed at the confocal YZ angle. (B–D) Whole-mount Fgf8 in situ hybridization of control cochleae at P0 (B), P8 (C), and P10 (D). (E) Whole-mount Fgf8 in situ hybridization in the cochlea from a PLP/CreERT+; Atoh1-HA+ mouse that was given tamoxifen at P0 and P1 and analyzed at P10. Arrows point to Fgf8+ cells. (F) Comparison of cell numbers from in situ hybridization of Fgf8+ cells and new HCs (Myosin VI+/Atoh1-HA+) at P10 showed no differences. (G–G’’’) Triple staining of Atoh1-HA, parvalbumin, and GFP in the cochlea of PLP/CreERT+; Atoh1-HA+; Fgf8-GFP+ mice at P10. Arrows target the new HC expressing Fgf8. OHCs: outer hair cells; IHCs: inner hair cells. Scale bars: 10 µm (A), 20 µm (B–E, G’’’).
Figure 8
Figure 8. New IHCs display outward current.
(A–A’’’) An EGFP+/Tdtomato+ new IHC was patched by the recording electrode (red arrow in A). The cochlea was dissected from the PLP/CreERT+; Atoh1-HA+; Rosa26-CAG-Tdtomatoflox/+; α9AChR-EGFP+ line. (B) Representative traces of voltage-dependent whole-cell currents from endogenous IHCs at P6 (blue), new IHCs at P11 (red), and endogenous OHCs at P6. Cells were voltage clamped at −84 mV and stepped from −120 to +50 mV in 10-mV increments. (C) Comparison of outward current amplitude of control OHCs (black) and IHCs (blue) and new IHCs (red). n: number of cells measured at different ages; Ctrl: control. Scale bars: 10 µm.
Figure 9
Figure 9. New IHCs are not fully differentiated.
(A–A’’) Whole-mount triple staining of otoferlin, vGlut3, and Atoh1-HA in the cochlea of a PLP/CreERT+; Atoh1-HA+ mouse given tamoxifen at P0 and P1 and analyzed at P130. Arrows show the same new IHC that was Atoh1-HA+/otoferlin+ but vGlut3-negative. (B–C) Double staining of Ctbp2 and Atoh1-HA in cochleae of control (B) and PLP/CreERT+; Atoh1-HA+ mice (C). The cell on the red dotted line (C) represents a new IHC, and the cell on the yellow dotted line (C) is an endogenous IHC. On the basis of Myosin VI staining, we determined the contour of the cell (dotted lines in B and C) and measured the density of Ctbp2. (D) Comparison of the number of Ctbp2 puncta per cell among different types of HCs (***P<0.001). (E-E’’) Co-staining of calbindin, Ctbp2, Tuj1, and Atoh1-HA in the cochlea of a PLP/CreERT+; Atoh1-HA+ mouse at P22. Arrows in (E, E') show the same endogenous IHC. Arrowheads in (E, E’’) show the same new IHC. The inset in (E) shows the Atoh1-HA channel of the new IHC only. (E') and (E’’) are images visualized in the confocal YZ plane. (F–I) Triple labeling of Ctbp2, GluR2, and Atoh1-HA in both the control (F-F’’’) and experimental (G-G’’’) groups. The same cell in the red circle is a new IHC in which GluR2 is absent (green spots), whereas the same cell in the yellow circle is the endogenous IHC in which the Ctbp2 and GluR2 are well aligned (yellow spots). The same circled cells in (G-G’’’) were visualized in high magnification images in (H) and (I). Endo: Endogenous; Ctrl: control; IHCs: inner hair cells; OHCs: outer hair cells. Scale bars: 20 µm (A’’), 10 µm (B, E, G’’’).
Figure 10
Figure 10. Comparison of auditory brainstem responses (ABRs) between control (grey line) and PLP/CreERT+; Atoh1-HA+ (black line) mice.
(A) ABR thresholds of 2 groups at 8, 16, and 32 kHz. (B) Representative of ABR recordings with wave1 peak positions (P1) (white dash line) and first negative peak N1 (white dot) positions. (C) ABR amplitude of wave1 (P1) at 16 kHz. (D) ABR peak latencies of wave1 (P1–N1) in the control (grey line) and PLP/CreERT+; Atoh1-HA+ (black line) mice at 16 kHz. *P<0.05, **P<0.01, and ***P<0.001 as determined by a 2-way ANOVA followed by a Student's t-test with a Bonferroni correction.

Similar articles

Cited by

References

    1. Walters BJ, Zuo J (2013) Postnatal development, maturation and aging in the mouse cochlea and their effects on hair cell regeneration. Hear Res 297: 68–83. - PMC - PubMed
    1. Brigande JV, Heller S (2009) Quo vadis, hair cell regeneration? Nat Neurosci 12: 679–685. - PMC - PubMed
    1. Lewis RM, Hume CR, Stone JS (2012) Atoh1 expression and function during auditory hair cell regeneration in post-hatch chickens. Hear Res 289: 74–85. - PMC - PubMed
    1. Fekete DM, Muthukumar S, Karagogeos D (1998) Hair cells and supporting cells share a common progenitor in the avian inner ear. J Neurosci 18: 7811–7821. - PMC - PubMed
    1. Bermingham NA, Hassan BA, Price SD, Vollrath MA, Ben-Arie N, et al. (1999) Math1: an essential gene for the generation of inner ear hair cells. Science 284: 1837–1841. - PubMed

Publication types

MeSH terms

Substances