A multiplex two-color real-time PCR method for quality-controlled molecular diagnostic testing of FFPE samples
- PMID: 24586747
- PMCID: PMC3931751
- DOI: 10.1371/journal.pone.0089395
A multiplex two-color real-time PCR method for quality-controlled molecular diagnostic testing of FFPE samples
Abstract
Background: Reverse transcription quantitative real-time PCR (RT-qPCR) tests support personalized cancer treatment through more clinically meaningful diagnosis. However, samples obtained through standard clinical pathology procedures are formalin-fixed, paraffin-embedded (FFPE) and yield small samples with low integrity RNA containing PCR interfering substances. RT-qPCR tests able to assess FFPE samples with quality control and inter-laboratory reproducibility are needed.
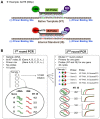
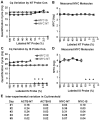
Methods: We developed an RT-qPCR method by which 1) each gene was measured relative to a known number of its respective competitive internal standard molecules to control for interfering substances, 2) two-color fluorometric hydrolysis probes enabled analysis on a real-time platform, 3) external standards controlled for variation in probe fluorescence intensity, and 4) pre-amplification maximized signal from FFPE RNA samples. Reagents were developed for four genes comprised by a previously reported lung cancer diagnostic test (LCDT) then subjected to analytical validation using synthetic native templates as test articles to assess linearity, signal-to-analyte response, lower detection threshold, imprecision and accuracy. Fitness of this method and these reagents for clinical testing was assessed in FFPE normal (N = 10) and malignant (N = 10) lung samples.
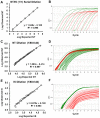
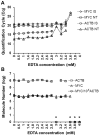
Results: Reagents for each of four genes, MYC, E2F1, CDKN1A and ACTB comprised by the LCDT had acceptable linearity (R(2)>0.99), signal-to-analyte response (slope 1.0 ± 0.05), lower detection threshold (<10 molecules) and imprecision (CV <20%). Poisson analysis confirmed accuracy of internal standard concentrations. Internal standards controlled for experimentally introduced interference, prevented false-negatives and enabled pre-amplification to increase signal without altering measured values. In the fitness for purpose testing of this two-color fluorometric LCDT using surgical FFPE samples, the diagnostic accuracy was 93% which was similar to that previously reported for analysis of fresh samples.
Conclusions: This quality-controlled two-color fluorometric RT-qPCR approach will facilitate the development of reliable, robust RT-qPCR-based molecular diagnostic tests in FFPE clinical samples.
Conflict of interest statement
Figures


Similar articles
-
Preparation of archival formalin-fixed paraffin-embedded mouse liver samples for use with the Agilent gene expression microarray platform.J Pharmacol Toxicol Methods. 2013 Sep-Oct;68(2):260-268. doi: 10.1016/j.vascn.2013.02.008. Epub 2013 Mar 1. J Pharmacol Toxicol Methods. 2013. PMID: 23458726
-
Technical validation of an RT-qPCR in vitro diagnostic test system for the determination of breast cancer molecular subtypes by quantification of ERBB2, ESR1, PGR and MKI67 mRNA levels from formalin-fixed paraffin-embedded breast tumor specimens.BMC Cancer. 2016 Jul 7;16:398. doi: 10.1186/s12885-016-2476-x. BMC Cancer. 2016. PMID: 27389414 Free PMC article.
-
Development and evaluation of a novel RT-qPCR based test for the quantification of HER2 gene expression in breast cancer.Gene. 2017 Mar 20;605:114-122. doi: 10.1016/j.gene.2016.12.027. Epub 2016 Dec 28. Gene. 2017. PMID: 28039034
-
Next generation diagnostic molecular pathology: critical appraisal of quality assurance in Europe.Mol Oncol. 2014 Jun;8(4):830-9. doi: 10.1016/j.molonc.2014.03.004. Epub 2014 Mar 18. Mol Oncol. 2014. PMID: 24704265 Free PMC article. Review.
-
The workflow of single-cell expression profiling using quantitative real-time PCR.Expert Rev Mol Diagn. 2014 Apr;14(3):323-31. doi: 10.1586/14737159.2014.901154. Expert Rev Mol Diagn. 2014. PMID: 24649819 Free PMC article. Review.
Cited by
-
A high-throughput method to detect RNA profiling by integration of RT-MLPA with next generation sequencing technology.Oncotarget. 2017 Jul 11;8(28):46071-46080. doi: 10.18632/oncotarget.17551. Oncotarget. 2017. PMID: 28545022 Free PMC article.
-
RNAseq analysis of bronchial epithelial cells to identify COPD-associated genes and SNPs.BMC Pulm Med. 2018 Mar 5;18(1):42. doi: 10.1186/s12890-018-0603-y. BMC Pulm Med. 2018. PMID: 29506519 Free PMC article.
-
Control for stochastic sampling variation and qualitative sequencing error in next generation sequencing.Biomol Detect Quantif. 2015 Sep 1;5:30-37. doi: 10.1016/j.bdq.2015.08.003. Biomol Detect Quantif. 2015. PMID: 26693143 Free PMC article.
-
Improving the Prediction of Prostate Cancer Overall Survival by Supplementing Readily Available Clinical Data with Gene Expression Levels of IGFBP3 and F3 in Formalin-Fixed Paraffin Embedded Core Needle Biopsy Material.PLoS One. 2016 Jan 5;11(1):e0145545. doi: 10.1371/journal.pone.0145545. eCollection 2016. PLoS One. 2016. PMID: 26731648 Free PMC article.
-
Straightforward and sensitive RT-qPCR based gene expression analysis of FFPE samples.Sci Rep. 2016 Feb 22;6:21418. doi: 10.1038/srep21418. Sci Rep. 2016. PMID: 26898768 Free PMC article.
References
-
- Coyle VM, Johnston PG (2010) Genomic markers for decision making: what is preventing us from using markers? Nature Reviews Clinical Oncology 7: 90–97. - PubMed
-
- Khleif SN, Doroshow JH, Hait WN, Colla A-F-NCB (2010) AACR-FDA-NCI Cancer Biomarkers Collaborative Consensus Report: Advancing the Use of Biomarkers in Cancer Drug Development. Clinical Cancer Research 16: 3299–3318. - PubMed
-
- Antonov J, Goldstein DR, Oberli A, Baltzer A, Pirotta M, et al. (2005) Reliable gene expression measurements from degraded RNA by quantitative real-time PCR depend on short amplicons and a proper normalization. Laboratory Investigation 85: 1040–1050. - PubMed
Publication types
MeSH terms
Grants and funding
LinkOut - more resources
Full Text Sources
Other Literature Sources
Miscellaneous

