

Multiple sleep alterations in mice lacking cannabinoid type 1 receptors
- PMID: 24586776
- PMCID: PMC3930731
- DOI: 10.1371/journal.pone.0089432
Multiple sleep alterations in mice lacking cannabinoid type 1 receptors
Abstract
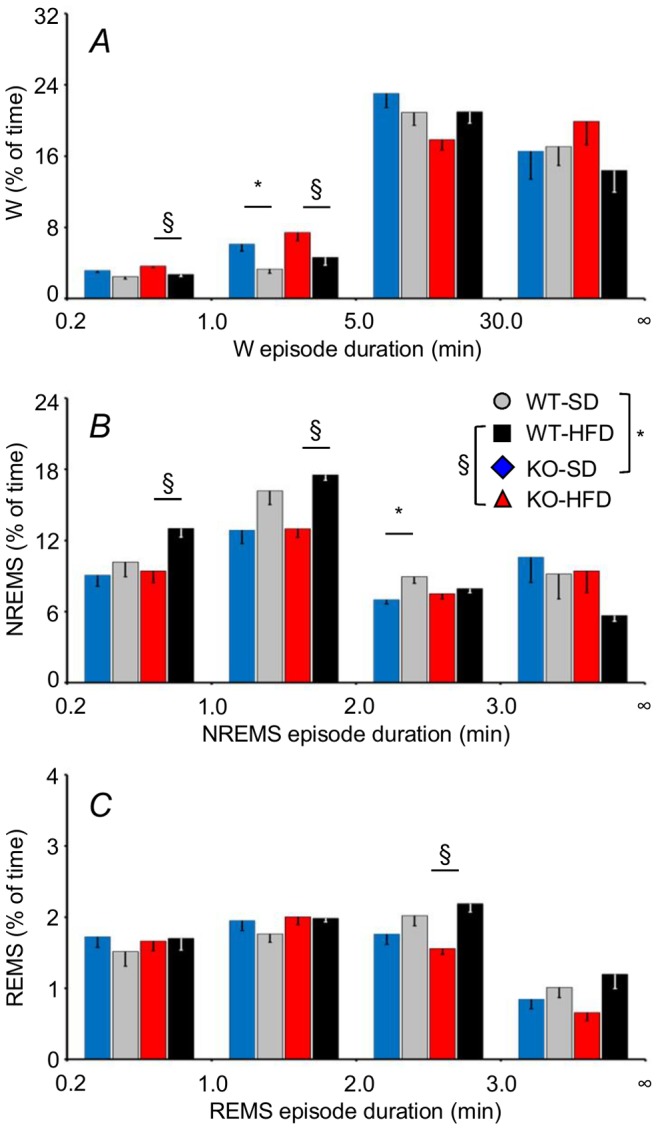
Cannabinoid type 1 (CB1) receptors are highly expressed in the brain and play a role in behavior control. Endogenous cannabinoid signaling is modulated by high-fat diet (HFD). We investigated the consequences of congenital lack of CB1 receptors on sleep in mice fed standard diet (SD) and HFD. CB1 cannabinoid receptor knock-out (KO) and wild-type (WT) mice were fed SD or HFD for 4 months (n = 9-10 per group). Mice were instrumented with electroencephalographic (EEG) and electromyographic electrodes. Recordings were performed during baseline (48 hours), sleep deprivation (gentle handling, 6 hours), sleep recovery (18 hours), and after cage switch (insomnia model paradigm, 6 hours). We found multiple significant effects of genotype on sleep. In particular, KO spent more time awake and less time in non-rapid-eye-movement sleep (NREMS) and rapid-eye-movement sleep (REMS) than WT during the dark (active) period but not during the light (rest) period, enhancing the day-night variation of wake-sleep amounts. KO had slower EEG theta rhythm during REMS. REMS homeostasis after sleep deprivation was less effective in KO than in WT. Finally, KO habituated more rapidly to the arousing effect of the cage-switch test than WT. We did not find any significant effects of diet or of diet x genotype interaction on sleep. The occurrence of multiple sleep alterations in KO indicates important roles of CB1 cannabinoid receptors in limiting arousal during the active period of the day, in sleep regulation, and in sleep EEG in mice.
Conflict of interest statement
Figures


Similar articles
-
Sleep-wake behavior and responses to sleep deprivation of mice lacking both interleukin-1 beta receptor 1 and tumor necrosis factor-alpha receptor 1.Brain Behav Immun. 2008 Aug;22(6):982-93. doi: 10.1016/j.bbi.2008.02.001. Epub 2008 Mar 7. Brain Behav Immun. 2008. PMID: 18329246 Free PMC article.
-
Cardiorespiratory anomalies in mice lacking CB1 cannabinoid receptors.PLoS One. 2014 Jun 20;9(6):e100536. doi: 10.1371/journal.pone.0100536. eCollection 2014. PLoS One. 2014. PMID: 24950219 Free PMC article.
-
Behavioral state instability in orexin knock-out mice.J Neurosci. 2004 Jul 14;24(28):6291-300. doi: 10.1523/JNEUROSCI.0586-04.2004. J Neurosci. 2004. PMID: 15254084 Free PMC article.
-
Spontaneous sleep and homeostatic sleep regulation in ghrelin knockout mice.Am J Physiol Regul Integr Comp Physiol. 2007 Jul;293(1):R510-7. doi: 10.1152/ajpregu.00155.2007. Epub 2007 Apr 4. Am J Physiol Regul Integr Comp Physiol. 2007. PMID: 17409264
-
Counterpointing the functional role of the forebrain and of the brainstem in the control of the sleep-waking system.J Sleep Res. 2004 Sep;13(3):179-208. doi: 10.1111/j.1365-2869.2004.00412.x. J Sleep Res. 2004. PMID: 15339255 Review.
Cited by
-
CB1 receptor coupling to extracellular regulated kinase via multiple Gαi/o isoforms.Neuroreport. 2025 Mar 5;36(4):191-195. doi: 10.1097/WNR.0000000000002138. Epub 2025 Feb 12. Neuroreport. 2025. PMID: 39975996
-
Cerebral Blood Flow Changes and Their Spatial Correlations With GABAa and Dopamine-D1 Receptor Explaining Individual Differences in Chronic Insomnia and the Therapeutic Effects of Acupuncture.Hum Brain Mapp. 2025 Mar;46(4):e70183. doi: 10.1002/hbm.70183. Hum Brain Mapp. 2025. PMID: 40022556 Free PMC article.
-
THC and CBD: Similarities and differences between siblings.Neuron. 2023 Feb 1;111(3):302-327. doi: 10.1016/j.neuron.2022.12.022. Epub 2023 Jan 12. Neuron. 2023. PMID: 36638804 Free PMC article. Review.
-
Accurate discrimination of the wake-sleep states of mice using non-invasive whole-body plethysmography.Sci Rep. 2017 Jan 31;7:41698. doi: 10.1038/srep41698. Sci Rep. 2017. PMID: 28139776 Free PMC article.
-
Cannabinoids, Endocannabinoids and Sleep.Front Mol Neurosci. 2020 Jul 22;13:125. doi: 10.3389/fnmol.2020.00125. eCollection 2020. Front Mol Neurosci. 2020. PMID: 32774241 Free PMC article.
References
-
- Matsuda LA, Lolait SJ, Brownstein MJ, Young AC, Bonner TI (1990) Structure of a cannabinoid receptor and functional expression of the cloned cDNA. Nature 346: 561–564. - PubMed
-
- Huestis MA, Gorelick DA, Heishman SJ, Preston KL, Nelson RA, et al. (2001) Blockade of effects of smoked marijuana by the CB1-selective cannabinoid receptor antagonist SR141716. Arch Gen Psychiatry 58: 322–328. - PubMed
-
- Di Marzo V, Melck D, Bisogno T, De Petrocellis L (1998) Endocannabinoids: endogenous cannabinoid receptor ligands with neuromodulatory action. Trends Neurosci 21: 521–528. - PubMed
-
- Mechoulam R, Parker LA (2013) The endocannabinoid system and the brain. Annu Rev Psychol 64: 21–47. - PubMed
Publication types
MeSH terms
Substances
LinkOut - more resources
Full Text Sources
Other Literature Sources
Molecular Biology Databases
Research Materials
