

Molecular recognition in complexes of TRF proteins with telomeric DNA
- PMID: 24586793
- PMCID: PMC3935891
- DOI: 10.1371/journal.pone.0089460
Molecular recognition in complexes of TRF proteins with telomeric DNA
Abstract
Telomeres are specialized nucleoprotein assemblies that protect the ends of linear chromosomes. In humans and many other species, telomeres consist of tandem TTAGGG repeats bound by a protein complex known as shelterin that remodels telomeric DNA into a protective loop structure and regulates telomere homeostasis. Shelterin recognizes telomeric repeats through its two major components known as Telomere Repeat-Binding Factors, TRF1 and TRF2. These two homologous proteins are therefore essential for the formation and normal function of telomeres. Indeed, TRF1 and TRF2 are implicated in a plethora of different cellular functions and their depletion leads to telomere dysfunction with chromosomal fusions, followed by apoptotic cell death. More specifically, it was found that TRF1 acts as a negative regulator of telomere length, and TRF2 is involved in stabilizing the loop structure. Consequently, these proteins are of great interest, not only because of their key role in telomere maintenance and stability, but also as potential drug targets. In the current study, we investigated the molecular basis of telomeric sequence recognition by TRF1 and TRF2 and their DNA binding mechanism. We used molecular dynamics (MD) to calculate the free energy profiles for binding of TRFs to telomeric DNA. We found that the predicted binding free energies were in good agreement with experimental data. Further, different molecular determinants of binding, such as binding enthalpies and entropies, the hydrogen bonding pattern and changes in surface area, were analyzed to decompose and examine the overall binding free energies at the structural level. With this approach, we were able to draw conclusions regarding the consecutive stages of sequence-specific association, and propose a novel aspartate-dependent mechanism of sequence recognition. Finally, our work demonstrates the applicability of computational MD-based methods to studying protein-DNA interactions.
Conflict of interest statement
Figures
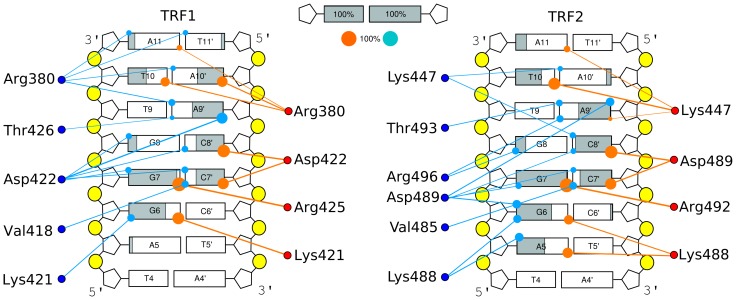
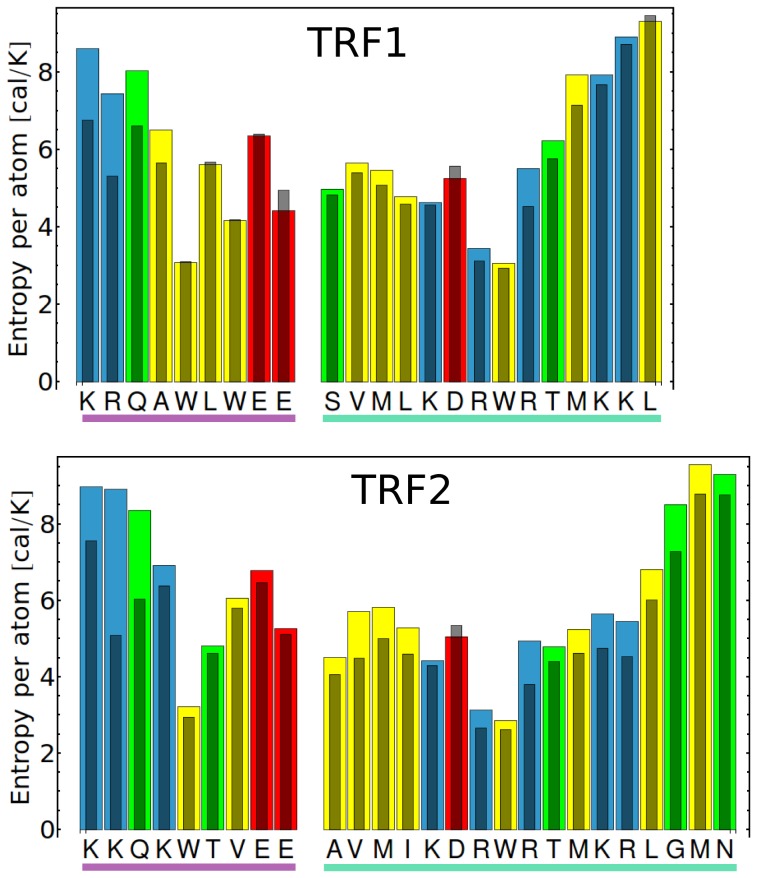
 0.05 are included. Grey percentage bars show the probability for a given base to be involved, at any given time, in either direct or water-mediated hydrogen bonds with the protein.
Similar articles
-
Comparison between TRF2 and TRF1 of their telomeric DNA-bound structures and DNA-binding activities.Protein Sci. 2005 Jan;14(1):119-30. doi: 10.1110/ps.04983705. Protein Sci. 2005. PMID: 15608118 Free PMC article.
-
TRF1 and TRF2 binding to telomeres is modulated by nucleosomal organization.Nucleic Acids Res. 2015 Jul 13;43(12):5824-37. doi: 10.1093/nar/gkv507. Epub 2015 May 20. Nucleic Acids Res. 2015. PMID: 25999344 Free PMC article.
-
How the human telomeric proteins TRF1 and TRF2 recognize telomeric DNA: a view from high-resolution crystal structures.EMBO Rep. 2005 Jan;6(1):39-45. doi: 10.1038/sj.embor.7400314. EMBO Rep. 2005. PMID: 15608617 Free PMC article.
-
Post-translational modifications of TRF1 and TRF2 and their roles in telomere maintenance.Mech Ageing Dev. 2012 Jun;133(6):421-34. doi: 10.1016/j.mad.2012.05.002. Epub 2012 May 23. Mech Ageing Dev. 2012. PMID: 22634377 Review.
-
Telomere Repeat-Binding Factor 2 Is Responsible for the Telomere Attachment to the Nuclear Membrane.Adv Protein Chem Struct Biol. 2015;101:67-96. doi: 10.1016/bs.apcsb.2015.06.009. Epub 2015 Oct 21. Adv Protein Chem Struct Biol. 2015. PMID: 26572976 Review.
Cited by
-
Shelterin complex gene: Prognosis and therapeutic vulnerability in cancer.Biochem Biophys Rep. 2021 Feb 2;26:100937. doi: 10.1016/j.bbrep.2021.100937. eCollection 2021 Jul. Biochem Biophys Rep. 2021. PMID: 33553693 Free PMC article. Review.
-
Protein disorder-to-order transition enhances the nucleosome-binding affinity of H1.Nucleic Acids Res. 2020 Jun 4;48(10):5318-5331. doi: 10.1093/nar/gkaa285. Nucleic Acids Res. 2020. PMID: 32356891 Free PMC article.
-
How proteins bind to DNA: target discrimination and dynamic sequence search by the telomeric protein TRF1.Nucleic Acids Res. 2017 Jul 27;45(13):7643-7654. doi: 10.1093/nar/gkx534. Nucleic Acids Res. 2017. PMID: 28633355 Free PMC article.
-
Cooperative DNA Recognition Modulated by an Interplay between Protein-Protein Interactions and DNA-Mediated Allostery.PLoS Comput Biol. 2015 Jun 11;11(6):e1004287. doi: 10.1371/journal.pcbi.1004287. eCollection 2015 Jun. PLoS Comput Biol. 2015. PMID: 26067358 Free PMC article.
-
Neurological Diseases can be Regulated by Phase Separation.Rev Physiol Biochem Pharmacol. 2025;187:273-338. doi: 10.1007/978-3-031-68827-0_16. Rev Physiol Biochem Pharmacol. 2025. PMID: 39838017 Review.
References
-
- Griffith JD, Comeau L, Rosenfield S, Stansel RM, Bianchi A, et al. (1999) Mammalian telomeres end in a large duplex loop. Cell 97: 503–514. - PubMed
-
- de Lange T (2004) T-loops and the origin of telomeres. Nat Rev Mol Cell Biol 5: 323–329. - PubMed
-
- de Lange T (2005) Shelterin: the protein complex that shapes and safeguards human telomeres. Genes Dev 19: 2100–2110. - PubMed
-
- Collins K, Mitchell JR (2002) Telomerase in the human organism. Oncogene 21: 564–579. - PubMed
Publication types
MeSH terms
Substances
LinkOut - more resources
Full Text Sources
Other Literature Sources
Research Materials
Miscellaneous
