. 2014 Feb 21;9(2):e89475.
doi: 10.1371/journal.pone.0089475. eCollection 2014.

Effect of bacteria on the wound healing behavior of oral epithelial cells

Affiliations

Effect of bacteria on the wound healing behavior of oral epithelial cells

Rupa Bhattacharya et al. PLoS One. .

Abstract

Wounded tissue offers opportunity to microflora to adhere, colonize, invade and infect surrounding healthy tissue. The bacteria of the oral cavity have the potential to alter the wound healing process by interacting with keratinocytes. The aim of this study was to investigate mechanisms through which oral bacteria may influence re-epithelialization by interacting with gingival keratinocytes. By an in vitro scratch assay we demonstrate that primary gingival keratinocytes have impaired closure when exposed to two well characterized oral bacteria, P. gingivalis, and to a lesser extent, F. nucleatum. P. gingivalis reduced wound closure by ∼ 40%, which was partially dependent on proteolytic activity, and bacteria was still present within infected cells 9 days later despite exposure to bacteria for only 24 h. Both oral bacteria caused keratinocyte apoptosis at the wound site with cell death being greatest at the wound edge. P. gingivalis and F. nucleatum adversely affected cell proliferation and the effect also had a spatial component being most striking at the edge. The impact of the bacteria was long lasting even when exposure was brief. Cell migration was compromised in bacteria challenged keratinocytes with P. gingivalis having more severe effect (p<0.05) than F. nucleatum. Quantitative real time PCR of bacteria challenged cells showed that P. gingivalis and to a lesser extent F. nucleatum significantly downregulated cell cycle genes cyclin1, CDK1, and CDK4 (p<0.05) that are critical for GI/S transition. Further, genes associated with cell migration such as integrin beta-3 and -6 were significantly downregulated by P. gingivalis (p<0.05).


Conflict of interest statement

Competing Interests: The authors have declared that no competing interests exist.

Figures

Figure 1
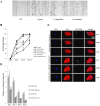
Figure 1. Delay in gap closure in pathogen infected scratch.
A. Scratch assay for assessing wound healing in periopathogen challenged primary gingival keratinocytes. The scratch width at the beginning of the scratch assay is represented by D0, wound healing on day 4 is represented in cells with no treatment (control), P. gingivalis and F. nucleatum challenge. Straight line represents the initial scratch boundary while curved line represents the leading edges of the healing wound. B. Graph shows scratch assay in oral primary keratinocytes where gap filling was measured based on the distance between the leading edges of the scratch. The data is average ± SEM from three independent experiments and shows ANOVA using Tukey HSD test. Significant difference between control and bacteria treatment is represented by *p<0.05. Significant difference between bacteria alone and bacteria along with Leupeptin treatment for a time point is represented by +p<0.05. C. CFSE based fluorescence of P. gingivalis co-localizing with actin was used to confirm presence of bacteria inside keratinocytes incubated without and with leupeptin. Bacteria inside keratinocyte is indicated by arrows. D. Graph represents the number of bacteria found within infected keratinocytes over period of 9 days thereby indicating the internalization of bacteria in medium without and with leupeptin. Values represent the average from three independent experiments.
Figure 2
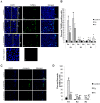
Figure 2. Assessment of apoptosis in cells undergoing scratch assay.
A. Primary oral keratinocytes subjected to scratch assay and challenged with bacteria were stained for apoptosis using TUNEL kit (b, e and h). Nuclei was stained with DAPI (a, d and g). Arrow indicates the edge of the scratch. The regions of the scratch as used for spatial analysis in apoptosis is marked with lines, R1 = scratch edge, R2 = area adjacent to scratch edge and R3 = at least 200 µm away from the scratch edge. For representation purpose region R3 is not to scale. The negative control on bacteria challenged scratch assay for TUNEL was done by staining without rTdT enzyme and is represented by (k). B. Graphical representation of the number of TUNEL positive cells divided by total number of cells and expressed in percent at different regions of the scratch and at different time points. D1 and D2 = day 1 and 2 in the graph. The graph is representative of average ± SEM from three independent experiments and shows one way ANOVA. Significant difference between control and bacteria treatment is represented by *p<0.05 and significant difference between the scratch edge and other regions of a particular treatment group for the same time point is represented by +p<0.05. For a particular region significant between P. gingivalis and F. nucleatum is represented by ++p<0.05.C. Annexin V staining for assessing apoptosis in scratch assay cells. Cells were challenged with bacteria for 24 h and then stained with anti Annexin V antibody to visualize apoptosis. Cell membranes showing staining for Annexin V were considered positive for apoptosis. D. Graph representing Annexin V positive cells in the three regions (R1, R2 and R3) of the wound; values are average ± SEM from three independent experiments. Significant difference between control and bacteria treatment is represented by *p<0.05, +p<0.05 represents difference between scratch edge and other regions for a particular treatment group, ++p<0.05 denotes significant difference between P. gingivalis and F. nucleatum for a region.
Figure 3
Figure 3. Assessment of cell proliferation in bacteria infected oral keratinocytes.
A. Cell proliferation during wound healing was visualized using antibody against PCNA (b, e and h) and total number of cells in the field were marked by staining nuclei with DAPI (a, d and g). In primary gingival epithelial keratinocytes cell proliferation was assessed based on PCNA staining in regions R1, R2 and R3. The isotype control on bacteria challenged scratch assay for PCNA staining is represented by (k) with (j) showing DAPI staining. B. Graph representing cell proliferation at different regions of the scratch and at different time points. The total number of cells was counted based on DAPI staining of nuclei and cell proliferation was counted based on positive PCNA staining. D1 and D2 = day 1 and 2 in the graph. Average was calculated from three independent experiments ± SEM and shows one way ANOVA. Significant difference between control and P. gingivalis or F. nucleatum is represented by *p<0.05, scratch edge and other regions of a treatment group for the same time point is represented by +p<0.05. For a particular region significant between P. gingivalis and F. nucleatum is represented by ++p<0.05.
Figure 4
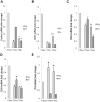
Figure 4. Analysis of expression of cell cycle genes in oral pathogen infected keratinocytes.
Real time RT PCR of gene expression of Cyclin1 (A), cell division kinases 1, 2 and 4 (B, C, D) and cyclin dependent kinase inhibitor P18 (E) in bacteria challenged cells. Graph represents level of gene expression on day 1 and 3 post infection compared to day zero, i.e. prior to bacteria challenge. The data is average from three independent experiments. The δδCt gene/L32 value of each gene was calculated with normalization against expression of L32 control gene. Statistical significance represented by *p<0.05 and significant difference between expression on day 1 and 3 within a treatment group is represented by +p<0.05 after Tukey HSD test.
Figure 5
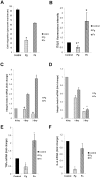
Figure 5. Study of cell migration and cytokine expression in pathogen infected oral keratinocytes.
A. Cell migration was assessed using transwell migration of keratinocytes after incubation with bacteria. The number of cells was counted by DAPI staining of nuclei using NIS element software under fluorescence microscope. Values were expressed as percent maximum against untreated control. Data are means ± SEM and shows one way ANOVA, with level of significance *p<0.05. B. Quantitation of integrin beta-3 at the protein level was determined by measuring fluorescence intensity of integrin beta-3 normalized to cell numbers. Values represent means ± SEM from three independent experiments. Significant between control and treatment *p<0.05 and between the two treatment groups +p<0.05 was determined by Ttest. C–D. Gene expression analysis of integrin beta-3 and -6 on day 1 and 3 post infection by real time RT PCR. The data is average from three independent experiments, δδCt gene/L32 value of each gene was calculated with normalization against expression of L32 control gene. Statistical significance represented by *p<0.05, and significant difference between expression on day 1 and 3 in a treatment group is represented by +p<0.05 after Tukey HSD test. E–F. mRNA levels of TNFα and IL-6 were measured by real time RT-PCR. Data shown are mean from three independent experiments. Statistical significance in differences of expression against control is represented by *p<0.05 after Ttest.

References

    1. Guo S, Dipietro LA (2010) Factors affecting wound healing. J Dent Res 89: 219–229. - PMC - PubMed
    1. Siddiqui AR, Bernstein JM (2010) Chronic wound infection: facts and controversies. Clin Dermatol 28: 519–526. - PubMed
    1. Scales BS, Huffnagle GB (2013) The microbiome in wound repair and tissue fibrosis. J Pathol. 229: 323–331. - PMC - PubMed
    1. Han A, Zenilman JM, Melendez JH, Shirtliff ME, Agostinho A, et al. (2011) The importance of a multifaceted approach to characterizing the microbial flora of chronic wounds. Wound Repair Regen 19: 532–541. - PMC - PubMed
    1. Kuboniwa M, Tribble GD, Hendrickson EL, Amano A, Lamont RJ, et al. (2012) Insights into the virulence of oral biofilms: discoveries from proteomics. Expert Rev Proteomics 9: 311–323. - PMC - PubMed

Publication types