. 2014 Feb 28;9(2):e89561.
doi: 10.1371/journal.pone.0089561. eCollection 2014.

Blockade of the programmed death-1 (PD1) pathway undermines potent genetic protection from type 1 diabetes

Affiliations

Blockade of the programmed death-1 (PD1) pathway undermines potent genetic protection from type 1 diabetes

Nora M Kochupurakkal et al. PLoS One. .

Abstract

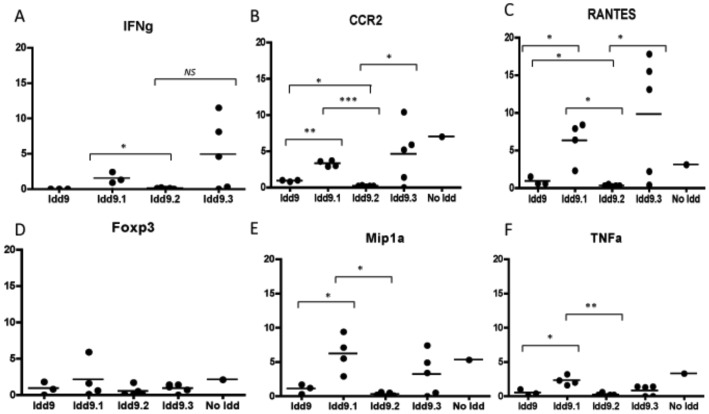
Aims/hypothesis: Inhibition of PD1-PDL1 signaling in NOD mice accelerates onset of type 1 diabetes implicating this pathway in suppressing the emergence of pancreatic beta cell reactive T-cells. However, the molecular mechanism by which PD1 signaling protects from type 1 diabetes is not clear. We hypothesized that differential susceptibility of Idd mouse strains to type 1 diabetes when challenged with anti PDL1 will identify genomic loci that collaborate with PD1 signaling in suppressing type 1 diabetes.

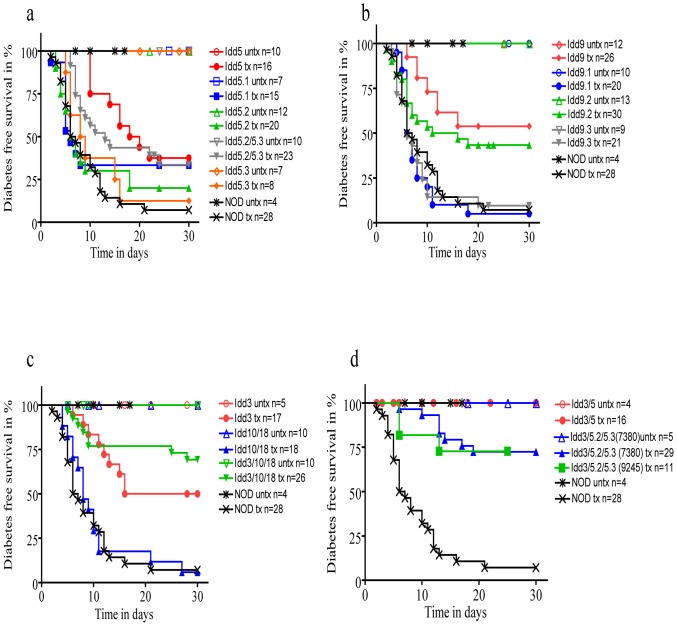
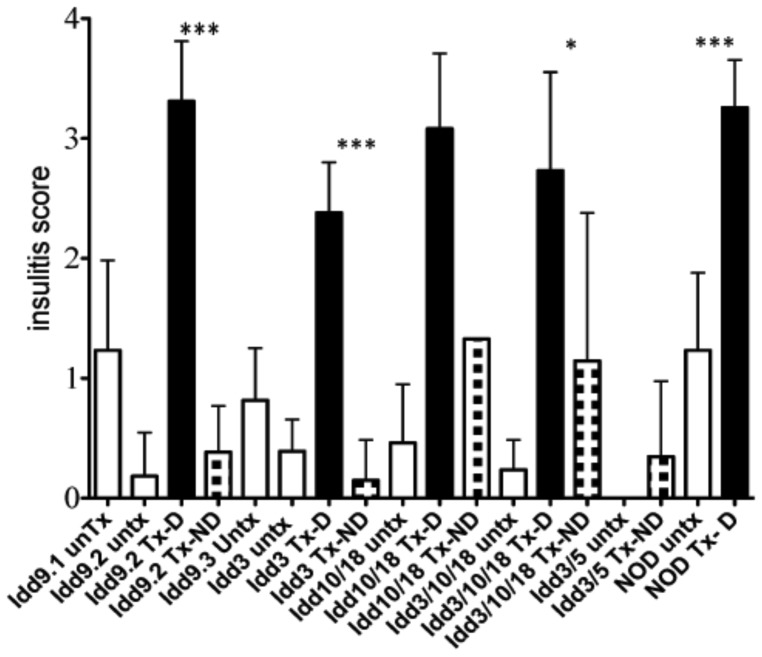
Methods: Anti PDL1 was administered to NOD and various Idd mouse strains at 10 weeks of age and onset of disease was monitored by measuring blood glucose levels. Additionally, histological evaluation of the pancreas was performed to determine degree of insulitis. Statistical analysis of the data was performed using Log-Rank and Student's t-test.

Results: Blockade of PDL1 rapidly precipitated type 1 diabetes in nearly all NOD Idd congenic strains tested, despite the fact that all are moderately (Idd5, Idd3 and Idd10/18) or highly (Idd3/10/18 and Idd9) protected from spontaneous type 1 diabetes by virtue of their protective Idd genes. Only the Idd3/5 strain, which is nearly 100% protected from spontaneous disease, remained normoglycemic following PDL1 blockade.

Conclusions: These results indicate that multiple Idd loci collaborate with PD1 signaling. Anti PDL1 treatment undermines a large portion of the genetic protection mediated by Idd genes in the NOD model of type 1 diabetes. Basal insulitis correlated with higher susceptibility to type 1 diabetes. These findings have important implications since the PD1 pathway is a target for immunotherapy.


Conflict of interest statement

Competing Interests: The authors have declared that no competing interests exist.

Figures

Figure 1
Figure 1. Incidence of diabetes in NOD congenic mouse strains undergoing anti PDL1 treatment.
Treatment was started at 10 weeks of age. a): Incidence of diabetes in Idd5 and sub-congenics Idd5.1, Idd5.2, Idd5.3 and Idd5.2/5.3 until day 30 after anti PDL1 treatment. In Idd5 mice (n = 16) 62.5% developed diabetes, in Idd5.1 (n = 15) 66.6%, in Idd5.2 (n = 20) 80%, in Idd5.3 (n = 8) 87.5% and in Idd5.2/5.3 (n = 23) 66.5%. NOD mice (n = 28) had a 92.5% incidence of diabetes by day 30. All control treated mice did not develop diabetes. b): In Idd9 (n = 26) 46.15% developed diabetes, in Idd9.1 (n = 20) 95%, in Idd9.2 (n = 30) 56.6% and in Idd9.3 (n = 21) 90.5%. c): Idd3 (n = 17) developed diabetes at a rate of 50%, Idd10/18 (n = 18) at 94.1%, Idd3/10/18 (n = 26) at 30.8%. d): In Idd3/5 (n = 16) 0% of anti - PDL1 treated mice developed diabetes, in Idd3/5.2/5.3 (n = 13) 15.4%. Statistics and cumulative incidence for the strains are shown in separate Tables for Figure 1. P-values were calculated using Log-rank (Mantel-Cox test).
Figure 2
Figure 2. Insulitis scores in anti PDL1 treated mice.
Idd congenic mice were grouped into control treated (untx, white columns, Idd9.1 n = 7, Idd9.2 n = 10, Idd9.3 n = 9, Idd3 n = 4, Idd10/18 n = 5, Idd3/10/18 n = 18, Idd3/5 n = 3, NOD n = 7), anti PDL1 treated diabetic (Tx-D, checked columns, Idd9.2 n = 4, Idd3 n = 5, Idd10/18 n = 8, Idd3/10/18 n = 6, NOD n = 11) and anti PDL1 treated non-diabetic (Tx-ND, black columns, Idd9.2 n = 5, Idd3 n = 5, Idd10/18 n = 1#, Idd3/10/18 n = 6, Idd3/5 n = 17) mice. The antibody treatment was given to 10-week old mice at day 0 (500 µg), and days 2, 4, 6, 8 and 10 (250 µg). The injections were stopped once the mouse had become diabetic and had a glucose reading of >250 mg/dl on two consecutive days. H&E sections of pancreases were scored for degree of infiltrating lymphocytes in islets. Results are expressed as Mean±SD. P-values are expressed as * (P<0.05), ** (P<0.01), *** (P<0.0001). # In case of the Idd10/18 mice, treatment with anti PDL1 resulted in 94% of diabetes incidence. Therefore, it was extremely difficult to increase the n of anti PDL1 treated non-diabetic group.
Figure 3
Figure 3. Quantitative PCR detection of cytokine, chemokine and transcription factor levels in pancreas tissue after anti PDL1 treatment in Idd9 (n = 3) and subcongenics Idd9.1(n = 3), Idd9.2 (n = 5), Idd9.3 (n = 5).
Mice (10 weeks old) were treated with 500 µg anti PDL1 on day 0 and 250 µg anti PDL1 on days 2, 4, 6, 8 and 10 by i.p. injection. Pancreas tissue was harvested on day 30 or when mice had turned diabetic. Horizontal lines show median value. P-values are expressed as * (P<0.05), ** (P<0.01), *** (P<0.0001) in figure. a): IFN-γ: Idd9.1 vs. Idd9.2 p = 0.0039; Idd9.1 vs. Idd9.3 p = 0.063. b): CCR2: Idd9 vs. Idd9.1 p = 0.0003; Idd9.1 vs. Idd9.2 p<0.0001; Idd9.2 vs. Idd9.3 p = 0.0431; Idd9 vs. Idd9.3 p = 0.0183. c): RANTES: Idd9 vs. Idd9.1 p = 0.022; Idd9.1 vs. Idd9.2 p = 0.0016; Idd9.2 vs. Idd9.3 p = 0.0284; Idd9 vs. Idd9.3 p = 0.0382. d): No significant differences in FoxP3 expression between Idd9 and subcongenics. e): MIP-1α: Idd9 vs. Idd9.1 p = 0.0257; Idd9.2 vs. Idd9.1 p = 0.0017. f): TNF-α:Idd9 vs. Idd9.1 p = 0.019; Idd9.2 vs. Idd9.1 p = 0.0004.
Figure 4
Figure 4. Proliferation of adoptively transferred BDC2.5 Tg CD4 T and NY8.3 tg CD8+ T cells in pancreatic LN and spleen of anti PDL1 treated NOD and Idd3/10/18 mice.
A) Representative CFSE dilution plot for each group is shown. Cells were gated on CD4+ Vbeta 4+. B) A representative CFSE dilution plot of transferred NY8.3tg T cells for each group is shown. Cells were gated on CD8+ Vbeta 8+.
Figure 5
Figure 5. Proliferation of adoptively transferred BDC2.5 Tg CD4 T and NY8.3 tg CD8+ T cells in pancreatic LN and spleen of anti PDL1 treated NOD and Idd3/10/18 mice.
a) Collective data from 3 out of 8 experiments of the percentage of CFSE-dividing cells (gated on CD4+ Vβ4+) are shown. Horizontal lines express mean value. For CD4+ T cells pLN, NOD, control vs. treated p = 0.0276; pLN, Idd3/10/18, control vs. treated p = 0.0002. b) A representative experiment from 3 performed is shown. For CD8 T cells pLN, Idd3/10/18 control vs. treated p = 0.0321, spleen Idd3/10/18 control vs. treated p = 0.0185.

Similar articles

Cited by

References

    1. Blank C, Mackensen A (2007) Contribution of the PD-L1/PD-1 pathway to T-cell exhaustion: an update on implications for chronic infections and tumor evasion. Cancer Immunol Immunother 56: 739–745. - PMC - PubMed
    1. Zhou Q, Munger ME, Highfill SL, Tolar J, Weigel BJ, et al. Program death-1 signaling and regulatory T cells collaborate to resist the function of adoptively transferred cytotoxic T lymphocytes in advanced acute myeloid leukemia. Blood 116: 2484–2493. - PMC - PubMed
    1. Trautmann L, Janbazian L, Chomont N, Said EA, Gimmig S, et al. (2006) Upregulation of PD-1 expression on HIV-specific CD8+ T cells leads to reversible immune dysfunction. Nat Med 12: 1198–1202. - PubMed
    1. Guleria I, Gubbels Bupp M, Dada S, Fife B, Tang Q, et al. (2007) Mechanisms of PDL1-mediated regulation of autoimmune diabetes. Clin Immunol 125: 16–25. - PubMed
    1. Fife BT, Pauken KE, Eagar TN, Obu T, Wu J, et al. (2009) Interactions between PD-1 and PD-L1 promote tolerance by blocking the TCR-induced stop signal. Nat Immunol 10: 1185–1192. - PMC - PubMed

Publication types

Substances