. 2014 Feb 26;9(2):e89649.
doi: 10.1371/journal.pone.0089649. eCollection 2014.

Ectopic TLX1 expression accelerates malignancies in mice deficient in DNA-PK

Affiliations

Ectopic TLX1 expression accelerates malignancies in mice deficient in DNA-PK

Konstantin Krutikov et al. PLoS One. .

Abstract

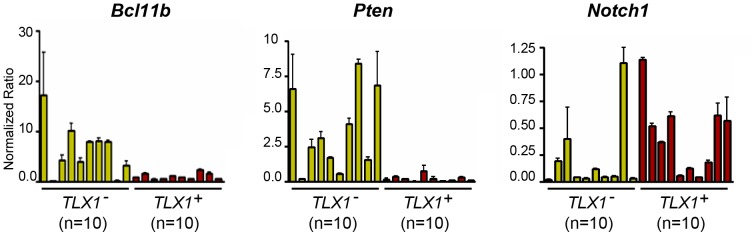
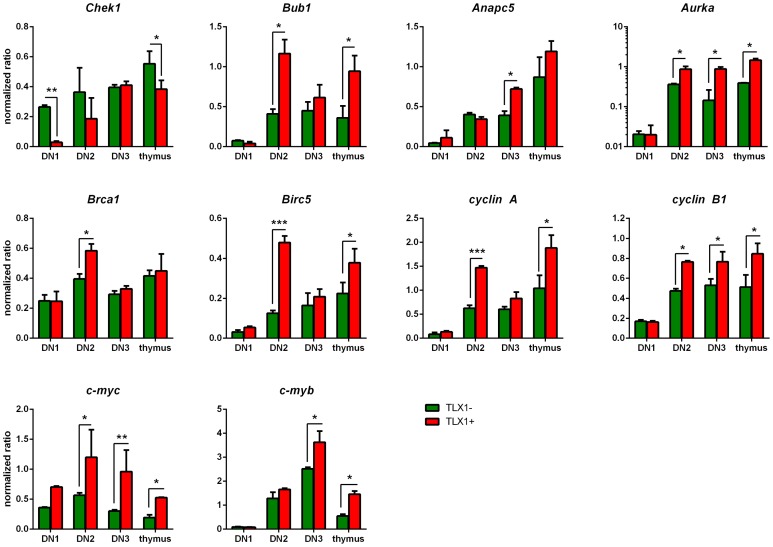
The noncluster homeobox gene HOX11/TLX1 (TLX1) is detected at the breakpoint of the t(10;14)(q24;q11) chromosome translocation in patients with T cell acute lymphoblastic leukemia (T-ALL). This translocation results in the inappropriate expression of TLX1 in T cells. The oncogenic potential of TLX1 was demonstrated in IgHμ-TLX1(Tg) mice which develop mature B cell lymphoma after a long latency period, suggesting the requirement of additional mutations to initiate malignancy. To determine whether dysregulation of genes involved in the DNA damage response contributed to tumor progression, we crossed IgHμ-TLX1(Tg) mice with mice deficient in the DNA repair enzyme DNA-PK (Prkdc(Scid/Scid) mice). IgHµ-TLX1(Tg)Prkdc(Scid/Scid) mice developed T-ALL and acute myeloid leukemia (AML) with reduced latency relative to control Prkdc(Scid/Scid) mice. Further analysis of thymi from premalignant mice revealed greater thymic cellularity concomitant with increased thymocyte proliferation and decreased apoptotic index. Moreover, premalignant and malignant thymocytes exhibited impaired spindle checkpoint function, in association with aneuploid karyotypes. Gene expression profiling of premalignant IgHµ-TLX1(Tg)Prkdc(Scid/Scid) thymocytes revealed dysregulated expression of cell cycle, apoptotic and mitotic spindle checkpoint genes in double negative 2 (DN2) and DN3 stage thymocytes. Collectively, these findings reveal a novel synergy between TLX1 and impaired DNA repair pathway in leukemogenesis.


Conflict of interest statement

Competing Interests: The authors have declared that no competing interests exist.

Figures

Figure 1
Figure 1. Expression of TLX1 in IgHμ-TLX1TgPrkdcScid/Scid premalignant thymocytes.
(A) OP9-DL1 co-cultures were initiated using fetal liver-derived IgHµ-TLX1TgPrkdcScid/Scid, PrkdcScid/Scid and wild type (WT) HSCs. Thymocytes were harvested on day 7 and flow sorted into DN1, DN2, DN3 and CD44-CD25- fractions on the basis of CD25 and CD44 expression. (B) RT-PCR analysis showing expression of the TLX1 transgene in IgHµ-TLX1TgPrkdcScid/Scid, PrkdcScid/Scid and WT thymocytes expanded in the OP9-DL1 co-culture system. Purified B220+ splenocytes isolated from wild type and IgHµ-TLX1Tg mice were used as negative and positive controls, respectively. TLX1 expression was not detected in immature thymocytes derived from PrkdcScid/Scid and WT mice. (C) Total thymocytes were obtained from thymi of six week old IgHµ-TLX1TgPrkdcScid/Scid and PrkdcScid/Scid mice and DN1, DN2, DN3 and CD44-CD25- fractions were flow sorted based on CD44 and CD25 expression. (D) qRT-PCR analysis showing expression of the TLX1 transgene in DN1, DN2, DN3 and CD44-CD25- thymocytes flow sorted from the thymi of IgHµ-TLX1TgPrkdcScid/Scid and PrkdcScid/Scid mice. B220+ splenocytes from healthy IgHµ-TLX1Tg mice were used as a positive control whereas thymocytes from PrkdcScid/Scid mice were used as a negative control. Expression of the TLX1 transgene in total thymocytes of IgHµ-TLX1TgPrkdcScid/Scid and PrkdcScid/Scid mice is also shown.
Figure 2
Figure 2. TLX1 accelerates T-ALL and AML in IgHµ-TLX1TgPrkdcScid/Scid mice.
Cohorts of mice were monitored for signs of disease for 25 months. A diagnosis of AML or T-ALL was made based on histological examination of bone marrow, spleen and thymic tissues. Survival of PrkdcScid/Scid and IgHµ-TLX1TgPrkdcScid/Scid mice are indicated by blue or red lines, respectively. (A) Disease free survival of PrkdcScid/Scid and IgHµ-TLX1TgPrkdcScid/Scid mice during the observation period, (p<0.0001). (B) T-ALL free survival of PrkdcScid/Scid and IgHµ-TLX1TgPrkdcScid/Scid mice during the 25 month observation period, (p<0.003). (C) AML free survival of PrkdcScid/Scid and IgHµ-TLX1TgPrkdcScid/Scid mice during the 25 month observation period, (p<0.0001). (D) Median survival of the complete IgHµ-TLX1TgPrkdcScid/Scid and PrkdcScid/Scid mouse cohorts developing T-ALL and/or AML. The column labeled as T-ALL/AML corresponds to Figure 1A and shows the median survival of IgHµ-TLX1TgPrkdcScid/Scid and PrkdcScid/Scid mice from cohorts developing either T-ALL or AML. The columns labeled T-ALL and AML correspond to Figure 1B and 1C and indicate median survival of IgHµ-TLX1TgPrkdcScid/Scid or PrkdcScid/Scid mice from cohorts developing T-ALL or AML respectively. (E) A one-year Kaplan-Meier survival probability estimate of the complete cohort of IgHµ-TLX1TgPrkdcScid/Scid and PrkdcScid/Scid mice developing T-ALL or AML.
Figure 3
Figure 3. TLX1-induced T-ALL in IgHµ-TLX1TgPrkdcScid/Scid mice.
(A) Hematoxylin and eosin staining of tissues isolated from premalignant PrkdcScid/Scid and IgHµ-TLX1TgPrkdcScid/Scid mice and IgHµ-TLX1TgPrkdcScid/Scid mice diagnosed with T-ALL. Magnification x40 (overview) and x100 (insert). Scale bars, 10 µm. (B) Immunohistochemical analysis of thymus and spleen from a premalignant IgHµ-TLX1TgPrkdcScid/Scid mouse and a moribund IgHµ-TLX1TgPrkdcScid/Scid mouse stained with an anti-Thy1.2 antibody. Magnification x20. Scale bars, 10 µm. (C) Cells from thymi, spleens and bone marrow of premalignant and moribund IgHµ-TLX1TgPrkdcScid/Scid mice were examined for cell surface expression of CD44, CD25, CD4, CD8, CD3, TCRαβ, TCRγδ and Thy1.2 (for T cells) and Gr-1 and Mac-1 (for myeloid cells).
Figure 4
Figure 4. Immunophenotype of TLX1-induced T-ALL.
Immunophenotype distribution showing heterogeneous expression of CD44, CD25, CD4 and CD8 in IgHµ-TLX1TgPrkdcScid/Scid T-ALL. Representative flow diagrams showing heterogeneous expression of CD4 and CD8 in TLX1-initiated leukemia are presented.
Figure 5
Figure 5. TLX1-induced AML in IgHµ-TLX1TgPrkdcScid/Scid mice.
(A) Hematoxylin and eosin staining of tissues isolated from premalignant PrkdcScid/Scid and IgHµ-TLX1TgPrkdcScid/Scid mice and from IgHµ-TLX1TgPrkdcScid/Scid mice diagnosed with AML. Magnification x40 (overview) and x100 (insert). Scale bars, 10 µm. (B) Cells from thymi, spleens and bone marrow of premalignant and moribund IgHµ-TLX1TgPrkdcScid/Scid mice were examined for cell surface expression of CD44, CD25, CD4, CD8, CD3, TCRαβ, TCRγδ and Thy1.2 (for T cells) and Gr-1 and Mac-1 (for myeloid cells).
Figure 6
Figure 6. qRT-PCR analysis of thymic tumors derived from PrkdcScid/Scid and IgHμ-TLX1TgPrkdcScid/Scid mice.
qRT-PCR analysis of expression of Bcl11b, Pten and Notch1 in tumors isolated from ten PrkdcScid/Scid and ten IgHµ-TLX1TgPrkdcScid/Scid mice. Data were normalized relative to β-actin. Each bar represents one tumor sample.
Figure 7
Figure 7. Heat map of the top ranking differentially expressed genes in flow sorted premalignant thymocytes.
(A) Venn diagrams depicting TLX1-associated up-regulated and down-regulated genes in DN1, DN2 and DN3 fractions. (B–D) Gene expression heat map of the top ranking differentially expressed genes in DN1 (B), DN2 (C) and DN3 (D) flow-sorted thymocytes from IgHµ-TLX1TgPrkdcScid/Scid and PrkdcScid/Scid mice. For each heat map, the first four columns (TLX1 +) show IgHµ-TLX1TgPrkdcScid/Scid thymocyte-derived samples, and the last four columns (TLX1 -) represent samples derived from thymocytes of PrkdcScid/Scid mice.
Figure 8
Figure 8. Validation of differential gene expression in premalignant thymocytes of PrkdcScid/Scid and IgHμ-TLX1TgPrkdcScid/Scid mice.
qRT-PCR analysis of selected genes whose protein products are involved in chromosome segregation (Chek1, Aurka and Bub1), cell cycle progression (Cyclin A, Cyclin B1, Anapc5, c-myc and c-myb) and apoptosis (Birc5, Brca1). Samples are presented as pairs with the first bar representing the level of expression of cells isolated from PrkdcScid/Scid mice and the second from IgHµ-TLX1 Tg PrkdcScid/Scid mice. Data were normalized relative to β-actin. Red bars: DN1; brown: DN2; green: DN3 cells; black; total unsorted thymocytes. Error bars represent SD. Statistical testing was performed using the student’s T-test. Statistically significant differences are indicated by asterisks (* depicts p<0.05, ** depicts p<0.01, *** depicts p<0.001).
Figure 9
Figure 9. Expression of TLX1 in IgHµ-TLX1TgPrkdcScid/Scid premalignant thymocytes increases cell viability and provides a proliferative advantage.
(A) Absolute cell numbers of thymocytes isolated from 20, six week old IgHµ-TLX1TgPrkdcScid/Scid and 20 PrkdcScid/Scid littermates (p<0.0001). (B) Thymocytes were flow sorted based on expression of CD44 and CD25 and absolute numbers of DN thymocytes were calculated using percentages obtained after flow sorting (p<0.0001). (C) Thymocytes from three, six week old IgHµ-TLX1TgPrkdcScid/Scid and PrkdcScid/Scid littermates were stained with Annexin V and PI than assessed by flow cytometric analysis for cell viability. The lower left quadrant of each panel contains viable cells, the upper right quadrant contains dead cells and the lower right quadrant contains early apoptotic cells. The percentage of cells in each quadrant is indicated. (D) Percentages of viable, apoptotic and dead thymocytes in thymi of IgHµ-TLX1TgPrkdcScid/Scid and PrkdcScid/Scid littermates, as determined by flow cytometry with Annexin V and PI staining. Error bars represent SD. (E) Histogram showing premalignant thymocytes obtained from PrkdcScid/Scid and IgHµ-TLX1TgPrkdcScid/Scid mice, 2 and 7 hours after intraperitoneal injection with 10 µM BrdU. (F) The percentages of proliferating cells in thymi of IgHµ-TLX1TgPrkdcScid/Scid and PrkdcScid/Scid littermates as determined by BrdU and PI staining. Data represent means of triplicate measurements with error bars to represent ± SD (p<0.0001). Statistically significant differences between compared samples are indicated by asterisks.
Figure 10
Figure 10. Chromosome analysis of premalignant thymocytes and tumors from PrkdcScid/Scid and IgHµ-TLX1TgPrkdcScid/Scid mice.
(A) Representative micrographs of Giemsa stained diploid, hyperdiploid, and hypoploid chromosome spreads from IgHµ-TLX1TgPrkdcScid/Scid mice. (B) Ploidy assessment of cultured thymocytes and thymic tumors obtained from premalignant and moribund PrkdcScid/Scid and IgHµ-TLX1TgPrkdcScid/Scid mice, respectively. For each of three samples, 40 to 100 metaphase spreads were analyzed. The percentage of aneuploid spreads relative to the total number of analyzed spreads was determined. Statistically significant differences (p<0.05) are indicated by asterisks. (C) Spectral karyotype analysis of a hypoploid tumor isolated from an IgHµ-TLX1TgPrkdcScid/Scid mouse with T-ALL. Loss of chromosome 12 and gain of chromosome 17 were found in 10% and 5% of analyzed cells, respectively. The karyotype is indicated below. (D) An abnormal, unbalanced trisomy 15 karyotype with a rob(5;15) translocation and two normal copies of chromosome 15. Examples of the rob(5;15) chromosomes and chromosome 15 are shown. The karyotype is indicated below.
Figure 11
Figure 11. Aberrant checkpoint regulation in thymocytes of IgHµ-TLX1TgPrkdcScid/Scid mice.
(A) Cell cycle analysis showing the percentage of thymocytes in S and G2/M as determined by PI staining for DNA content. Percentages of cells in S and G2/M are shown above the histograms. (B) BrdU labeling to assess bypass of the G2/M cell cycle checkpoint in PrkdcScid/Scid and IgHµ-TLX1TgPrkdcScid/Scid thymocyte cultures. Thymocytes were treated with colchicine to induce mitotic arrest then exposed to BrdU to assess cell cycling. BrdU incorporation was detected by BrdU immunolabeling and nulcei were revealed by DAPI staining. White arrows on the merged images indicate cycling thymocytes. The histogram depicts the mean percentages of BrdU-positive cells assessed by scoring 20 random fields. Statistically significant differences (p<0.05) are indicated by asterisks.

Similar articles

Cited by

References

    1. Dube ID, Kamel-Reid S, Yuan CC, Lu M, Wu X, et al. (1991) A novel human homeobox gene lies at the chromosome 10 breakpoint in lymphoid neoplasias with chromosomal translocation t(10;14). Blood 78: 2996–3003. - PubMed
    1. Hatano M, Roberts CW, Minden M, Crist WM, Korsmeyer SJ (1991) Deregulation of a homeobox gene, HOX11, by the t(10;14) in T cell leukemia. Science 253: 79–82. - PubMed
    1. Kennedy MA, Gonzalez-Sarmiento R, Kees UR, Lampert F, Dear N, et al. (1991) HOX11, a homeobox-containing T-cell oncogene on human chromosome 10q24. Proc Natl Acad Sci U S A 88: 8900–8904. - PMC - PubMed
    1. Ferrando AA, Neuberg DS, Staunton J, Loh ML, Huard C, et al. (2002) Gene expression signatures define novel oncogenic pathways in T cell acute lymphoblastic leukemia. Cancer Cell 1: 75–87. - PubMed
    1. De Keersmaecker K, Real PJ, Gatta GD, Palomero T, Sulis ML, et al. (2010) The TLX1 oncogene drives aneuploidy in T cell transformation. Nat Med 16: 1321–1327. - PMC - PubMed

Publication types

MeSH terms

Associated data