. 2014 Feb 25;9(2):e89847.
doi: 10.1371/journal.pone.0089847. eCollection 2014.

Increased actin polymerization and stabilization interferes with neuronal function and survival in the AMPKγ mutant Loechrig

Affiliations

Increased actin polymerization and stabilization interferes with neuronal function and survival in the AMPKγ mutant Loechrig

Mandy Cook et al. PLoS One. .

Abstract

loechrig (loe) mutant flies are characterized by progressive neuronal degeneration, behavioral deficits, and early death. The mutation is due to a P-element insertion in the gene for the γ-subunit of the trimeric AMP-activated protein kinase (AMPK) complex, whereby the insertion affects only one of several alternative transcripts encoding a unique neuronal isoform. AMPK is a cellular energy sensor that regulates a plethora of signaling pathways, including cholesterol and isoprenoid synthesis via its downstream target hydroxy-methylglutaryl (HMG)-CoA reductase. We recently showed that loe interferes with isoprenoid synthesis and increases the prenylation and thereby activation of RhoA. During development, RhoA plays an important role in neuronal outgrowth by activating a signaling cascade that regulates actin dynamics. Here we show that the effect of loe/AMPKγ on RhoA prenylation leads to a hyperactivation of this signaling pathway, causing increased phosphorylation of the actin depolymerizating factor cofilin and accumulation of filamentous actin. Furthermore, our results show that the resulting cytoskeletal changes in loe interfere with neuronal growth and disrupt axonal integrity. Surprisingly, these phenotypes were enhanced by expressing the Slingshot (SSH) phosphatase, which during development promotes actin depolymerization by dephosphorylating cofilin. However, our studies suggest that in the adult SSH promotes actin polymerization, supporting in vitro studies using human SSH1 that suggested that SSH can also stabilize and bundle filamentous actin. Together with the observed increase in SSH levels in the loe mutant, our experiments suggest that in mature neurons SSH may function as a stabilization factor for filamentous actin instead of promoting actin depolymerization.


Conflict of interest statement

Competing Interests: D. Kretzschmar is an Academic editor for PlosOne. This does not alter the authors’ adherence to all the PLOS ONE policies on sharing data and materials.

Figures

Figure 1
Figure 1. loe interferes with the RhoA/LIMK pathway.
A. Schematic of the RhoA/LIMK pathway. AMPK negatively regulates isoprenoid synthesis. Isoprenylation allows RhoA’s association with membranes where it can subsequently be activated and interact with its downstream targets. B. Paraffin head section of a 10 d old homozygous loe fly reveals severe vacuolization (arrows). C. An age-matched female rok1/+;loe/loe fly shows less lesions. D. In contrast, a 10 d old female loe fly expressing LIMK via Appl-GAL4 reveals more and larger vacuoles than loe alone. E. Quantification of the area of vacuoles in loe flies with altered levels of Rho kinase (rok1) shows that increasing ROCK enhances the degeneration whereas reducing ROCK suppresses it. F. Quantification showing significantly less vacuolization in loe flies in which LIMK is knocked down than in loe flies alone. In contrast, overexpressing LIMK significantly increases the area of vacuoles and knocking down LIMK suppresses the degeneration in loe. All flies were females and the SEMs and number of brain hemispheres analyzed are indicated. *p<0.05, ***p<0.001. G. Overexpressing ROCK in wild type causes degeneration in the retina (arrows) and lamina (arrowheads). re = retina, la = lamina, me = medulla, lo = lobula, lb = lobula plate. Scale bar in B = 50 µm (also applies to C, D), bar in G = 25 µm.
Figure 2
Figure 2. loe shows increased levels of p-cofilin.
A. A Western Blot using α-p-cofilin reveals an increase in p-cofilin in loe compared to y w control flies, the genetic background of loe. Overexpressing TSR, TSRS3E, or LIMK in neurons via Appl-GAL4 also increases the levels of p-cofilin whereas tsrN96 A/+ flies show reduced levels. Expression of TSRS3A did not affect p-cofilin levels. Head extracts from 10 flies were loaded per lane. B. A Western blot using α- cofilin shows an increase in total cofilin in flies expressing TSR, TSRS3E, or TSRS3A with Appl-GAL4. tsrN96A/+ flies show a decrease in total cofilin whereas LIMK overexpressing flies (note the higher load in this lane) and loe flies do not show a change in total cofilin levels. Head extracts from 5 flies were loaded per lane. Loading controls using α-tubulin are shown below each blot.
Figure 3
Figure 3. loe interactions with tsr.
A. 5loe flies heterozygous for tsrN96A or tsr1 show a significantly reduced area of vacuoles compared to loe alone. Overexpression of TSR or phosphomimetic TSR (TSRS3E) via Appl-GAL4 has no effect on vacuole formation in 5 d old loe flies. Combining the constitutively active TSRS3A construct with loe is developmental lethal and could not be tested. Neither overexpression of TSR, TSRS3A, TSRS3E nor removing one copy of tsr caused vacuole formation in the wild type background. B. Analyzing loe flies expressing TSRS3E at 10 d of age reveals a significant increase in vacuolization compared to loe controls. C. tsrN96A/+;loe/loe flies show increased performance in fast phototaxis experiments compared to loe when tested at 5 d of age. Expression of the phosphomimetic TSRS3E construct with Appl-GAL4 enhances the locomotion deficits of loe and also has a significant effect when induced in the wild type background. Expression of TSRS3A or heterozygosity for tsrN96A had no effect in wild type but expression of TSR also causes behavioral deficits. A, B. n = number of brain hemispheres analyzed are indicated in each graph. C. n = number of independent experiments with groups of 3–6 flies. The error bars indicate SEMs. All the analyzed flies were females. *p<0.05, **p<0.01, ***p<0.001.
Figure 4
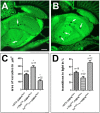
Figure 4. TSR also interacts with the AMPK knockdown.
A. A 9elav-GAL4, Appl-GAL4;UAS-AMPKγ RNAi fly also reveals formation of spongiform lesions (arrows). B. This phenotype is enhanced when expressing TSRS3E in these flies. C. Heterozygosity for tsrN96A suppresses the degeneration in the pan-neuronal knockdown of 9 d old AMPKγ via elav-GAL4, Appl-GAL4 whereas co-expression of TSRS3E significantly enhanced vacuole formation. UAS-GFP was expressed in the control AMPKγ knockdown to have equal numbers of UAS constructs. D. A comparable suppressing and enhancing effect of tsrN96A and TSRS3E is detectable when using 9 d elav-GAL4, Appl-GAL4;UAS-AMPKγ RNAi flies and performing fast phototaxis assays. Bar in A = 25 µm and also applies to B.
Figure 5
Figure 5. Reducing SSH levels suppresses loe phenotypes.
A. loe flies expressing additional SSH via Appl-GAL4 show an enhancement of vacuole formation whereas heterozygosity for ssh1–63 reduces vacuoles formation at 5 d of age. Neither an increase nor a decrease of SSH levels alone caused degeneration. B. Similarly, reducing SSH levels by co-expressing an SSH-RNAi construct with the AMPKγ RNAi construct via Appl-GAL4, elav-GAL4 decreases vacuole formation in 9 d old flies when compared to controls expressing GFP with the AMPKγ RNAi construct. In contrast, co-expression of SSH significantly enhances vacuole formation. C. Heterozygosity for ssh1–63 also suppresses the behavioral phenotype of 5 d old loe flies in fast phototaxis experiments, whereas overexpression of SSH (with Appl-GAL4) did not change the performance of loe. ssh1–63/+ or SSH overexpression flies alone did not show locomotion deficits. D. An improvement in performance is detectable in 9 d old flies when the AMPKγ RNAi construct is co-expressed with a SSH-RNAi construct (using Appl-GAL4, elav-GAL4). A, B. n = number of brain hemispheres analyzed are indicated in each graph. C, D. n = number of independent experiments with groups of 3–6 flies. All flies were females and the SEMs are indicated. *p<0.05, **p<0.01, ***p<0.001.
Figure 6
Figure 6. Overexpression of SSH does not reduce p-cofilin.
A. A Western blot using α-p-cofilin shows an increase in flies with reduced SSH levels. Overexpressing SSH does not reduce p-cofilin compared to wild type but seems to slightly increase the levels. Lysates from 10 heads were loaded in each lane. B. The levels of total cofilin were not altered when manipulating SSH. Lysates from 5 heads were loaded in each lane.
Figure 7
Figure 7. Filamentous actin is increased in loe.
A. loe flies show an increase in filamentous (F) actin compared to y w controls (G = globular actin). This is not altered by expressing TSR but heterozygosity for tsrN96A reduces F-actin in loe (compare lane 4 and 8). B. Expressing TSRS3E via Appl-GAL4 increases F-actin whereas flies expressing TSRS3A show less F-actin. C. Expressing additional SSH in loe further increases F-actin (compare lane 4 and 6) whereas ssh1–63/+;loe/loe flies show a reduction in F-actin (compare lane 4 and 8). D. Induction of SSH increases F-actin levels whereas heterozygosity for ssh1–63 had no effect. E. Quantification of the F-actin to G-actin ratio normalized to controls reveals a significant increase in loe compared to y w controls and in loe flies overexpressing SSH to loe. F. The ratio of F-actin to G-actin is also significantly increased in flies expressing TSRS3E or SSH. The number of independent experiments and the SEMs are indicated. *p<0.05, **p<0.01, ***p<0.001. G. The levels of total actin appear unchanged in loe.
Figure 8
Figure 8. SSH levels are increased in loe.
A. A Western blot using α-SSH shows increased levels of SSH in loe and in SSH overexpressing flies whereas the levels are reduced in ssh1–63/+ flies. Expressing SSH in the loe background results in a weaker band when compared to expression in the wild type background. A loading control using α-tubulin is shown below. B. Quantification showing the increase in SSH in loe compared to controls. The number of independent experiments and the SEMs are indicated. *p<0.05.
Figure 9
Figure 9. loe affects neurite length and axonal transport in cultured neurons.
A. y w control neuron 24 h in culture. B. loe neuron 24 h in culture. C. Counting the number of branch points does not reveal a difference between loe neurons and controls. D. Counting the number of neurites does not reveal a difference between loe neurons and controls. E. The average length of the longest neurite in primary neuronal cultures is significantly increased in loe neurons cultured for 24 h compared to y w control neurons. F. In contrast, loe neurons show shorter neurites when cultured for 48 h. G. A cultured neuron labeled with Mitotracker to follow the movement of mitochondria (arrows). H. The average velocity of mitochondria transported along neurites is significantly decreased in loe mutant neurons. The number of analyzed neurons and the SEMs are indicated. Scale bar in A = 10 µm (also applies to B), scale bar in G = 2 µm. *p<0.05, ***p<0.001.
Figure 10
Figure 10. loe flies show progressive neuritic degeneration.
A. Expression of GFP via pdf-GAL4 reveals the pattern of the PDF neurons and their projections into the medulla (arrowheads) in a 5 d old control fly. B. In a 1 d old loe fly, the overall pattern appears quite normal although the staining of the projections into the medulla appears somewhat weaker. C. In a 5 d old loe fly the arborizations in the medulla are thin or missing whereas the cell bodies are still easily detectable (arrow). Scale bar in A = 10 µm also applies to B and C).

Similar articles

Cited by

References

    1. Kemp BE, Mitchelhill KI, Stapleton D, Michell BJ, Chen ZP, et al. (1999) Dealing with energy demand: the AMP-activated protein kinase. Trends Biochem Sci 24: 22–25. - PubMed
    1. Steinberg GR, Kemp BE (2009) AMPK in Health and Disease. Physiol Rev 89: 1025–1078. - PubMed
    1. Hardie DG (2007) AMP-activated/SNF1 protein kinases: conserved guardians of cellular energy. Nat Rev Mol Cell Biol 8: 774–785. - PubMed
    1. Culmsee C, Monnig J, Kemp BE, Mattson MP (2001) AMP-activated protein kinase is highly expressed in neurons in the developing rat brain and promotes neuronal survival following glucose deprivation. J Mol Neurosci 17: 45–58. - PubMed
    1. Turnley AM, Stapleton D, Mann RJ, Witters LA, Kemp BE, et al. (1999) Cellular distribution and developmental expression of AMP-activated protein kinase isoforms in mouse central nervous system. J Neurochem 72: 1707–1716. - PubMed

Publication types

MeSH terms

LinkOut - more resources