. 2014 Feb 20;9(2):e89872.
doi: 10.1371/journal.pone.0089872. eCollection 2014.

Estimating oxygen needs for childhood pneumonia in developing country health systems: a new model for expecting the unexpected

Affiliations

Estimating oxygen needs for childhood pneumonia in developing country health systems: a new model for expecting the unexpected

Beverly D Bradley et al. PLoS One. .

Abstract

Background: Planning for the reliable and cost-effective supply of a health service commodity such as medical oxygen requires an understanding of the dynamic need or 'demand' for the commodity over time. In developing country health systems, however, collecting longitudinal clinical data for forecasting purposes is very difficult. Furthermore, approaches to estimating demand for supplies based on annual averages can underestimate demand some of the time by missing temporal variability.

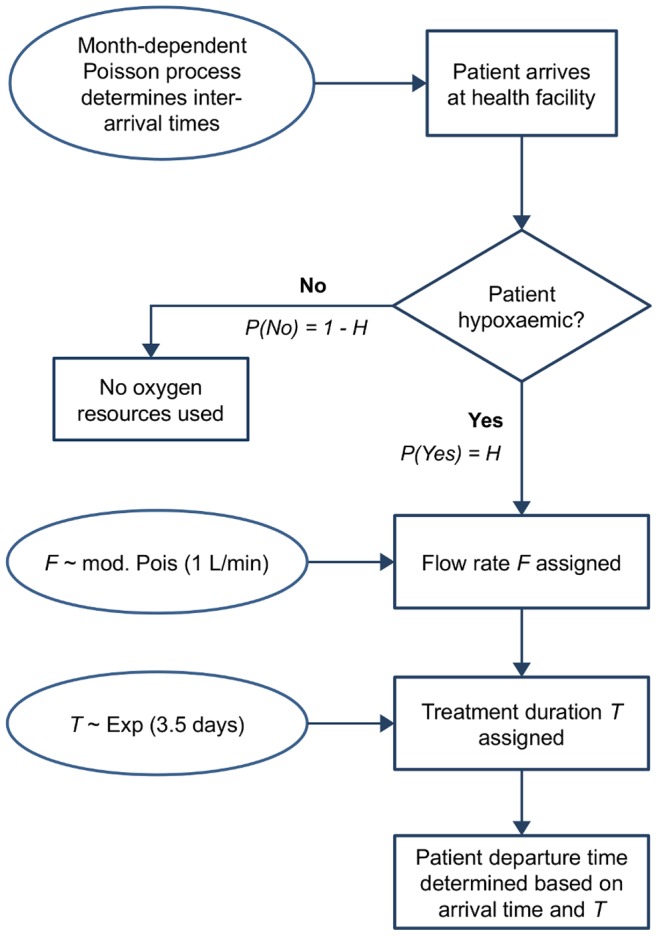
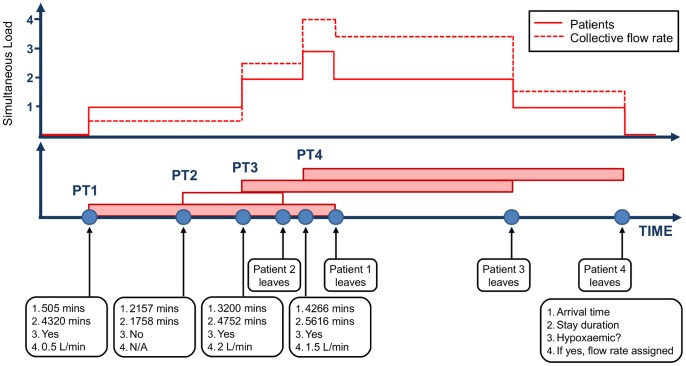
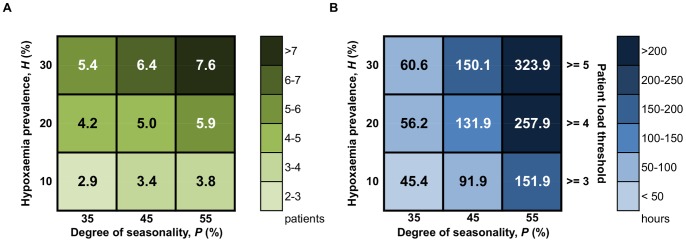
Methods: A discrete event simulation model was developed to estimate variable demand for a health service commodity using the important example of medical oxygen for childhood pneumonia. The model is based on five key factors affecting oxygen demand: annual pneumonia admission rate, hypoxaemia prevalence, degree of seasonality, treatment duration, and oxygen flow rate. These parameters were varied over a wide range of values to generate simulation results for different settings. Total oxygen volume, peak patient load, and hours spent above average-based demand estimates were computed for both low and high seasons.

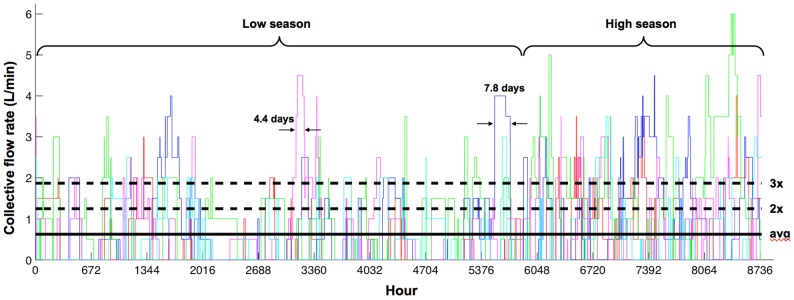
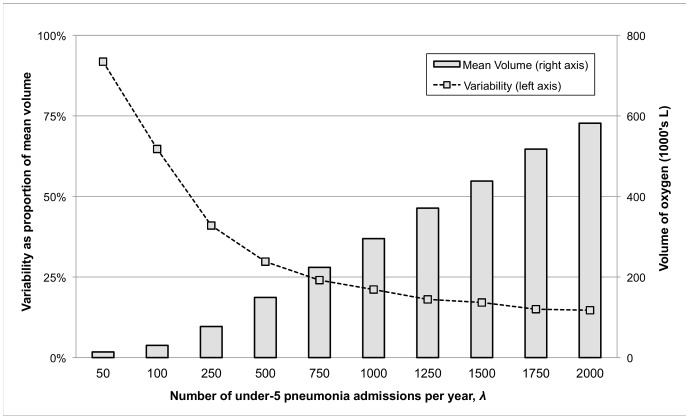
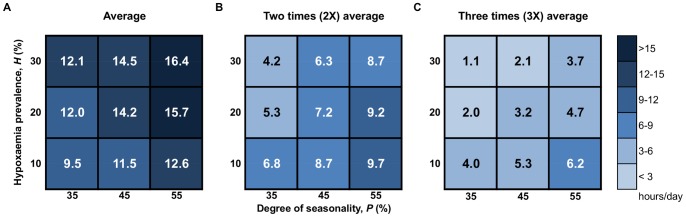
Findings: Oxygen demand estimates based on annual average values of demand factors can often severely underestimate actual demand. For scenarios with high hypoxaemia prevalence and degree of seasonality, demand can exceed average levels up to 68% of the time. Even for typical scenarios, demand may exceed three times the average level for several hours per day. Peak patient load is sensitive to hypoxaemia prevalence, whereas time spent at such peak loads is strongly influenced by degree of seasonality.

Conclusion: A theoretical study is presented whereby a simulation approach to estimating oxygen demand is used to better capture temporal variability compared to standard average-based approaches. This approach provides better grounds for health service planning, including decision-making around technologies for oxygen delivery. Beyond oxygen, this approach is widely applicable to other areas of resource and technology planning in developing country health systems.


Conflict of interest statement

Competing Interests: The authors have declared that no competing interests exist.

Figures

Figure 1
Figure 1. Process flow diagram of a patient’s pathway through the simulation.
Simulation continues until 365 days are reached.
Figure 2
Figure 2. Example timeline view of simulated patient arrivals and variable assignments.
Lower portion shows simulation ‘events’. Upper portion shows changing level of simultaneous patients on oxygen and collective flow rate (L/min) over time.
Figure 3
Figure 3. Hourly oxygen demand for a typical health facility.
Scenario inputs were 500 pneumonia admissions per year (λ), degree of seasonality (P) of 45%, high season duration (D) of 4 months, and hypoxaemia prevalence (H) of 13%. Different coloured lines represent five distinct simulation iterations. Horizontal lines represent the average-based estimate (solid), as well as 2 and 3 times this estimate (dashed), for this particular scenario. Prolonged periods of 4.4 and 7.8 days exceeding 3 times the average level in low season are shown.
Figure 4
Figure 4. Total oxygen demand and year-to-year variability in high season for pneumonia admissions (λ) ranging from 50 to 2000.
Other scenario inputs: degree of seasonality (P) of 45%, high season duration (D) of 4 months, and hypoxaemia prevalence (H) of 13%. Mean high season volume is averaged across 500 simulation iterations (right axis). Standard deviation as a percentage of the mean high season volume is plotted to represent variability across simulation iterations (left axis).
Figure 5
Figure 5. Peak demand in high season, measured in terms of both patients and time.
Sensitivity matrices show (A) maximum simultaneous patient load in high season; and (B) amount of time (hours) patient load exceeds selected peak patient load thresholds in high season, for hypoxaemia prevalence (H) ranging from 10 to 30% and degree of seasonality (P) ranging from 35 to 55%, averaged across 500 simulation iterations. In (B) thresholds of 3, 4 and 5 simultaneous patients were used for H levels of 10%, 20%, and 30%, respectively. Results are for λ = 500 pneumonia admissions per year.
Figure 6
Figure 6. Peak demand in high season, measured in terms of time above average level thresholds.
Sensitivity matrices show amount of time (hours/day) in high season that oxygen demand exceeds (A) 1 times; (B) 2 times, and; (C) 3 times average-based demand estimates for hypoxaemia prevalence (H) ranging from 10 to 30% and degree of seasonality (P) ranging from 35 to 55%, averaged across 500 simulation iterations. Results are for λ = 500 pneumonia admissions per year.

Similar articles

Cited by

References

    1. Children: Reducing Mortality (2012) Children: Reducing Mortality. World Health Organization. Available: http://www.who.int/mediacentre/factsheets/fs178/en/. Accessed June 2013.
    1. Hoffmann J, Rabezanahary H, Randriamarotia M, Ratsimbasoa A, Najjar J, et al. (2012) Viral and Atypical Bacterial Etiology of Acute Respiratory Infections in Children under 5 Years Old Living in a Rural Tropical Area of Madagascar. PLoS ONE 7: e43666 10.1371/journal.pone.0043666.t003 - DOI - PMC - PubMed
    1. Chew FT, Doraisingham S, Ling AE, Kumarasinghe G, Lee BW (1998) Seasonal trends of viral respiratory tract infections in the tropics. Epidemiol Infect 121: 121–128. - PMC - PubMed
    1. Shek LP-C, Lee B-W (2003) Epidemiology and seasonality of respiratory tract virus infections in the tropics. Paediatr Respir Rev 4: 105–111 10.1016/S1526-0542(03)00024-1 - DOI - PubMed
    1. Khor C-S, Sam I-C, Hooi P-S, Quek K-F, Chan Y-F (2012) Epidemiology and seasonality of respiratory viral infections in hospitalized children in Kuala Lumpur, Malaysia: a retrospective study of 27 years. BMC Pediatr 12: 32 10.1186/1471-2431-12-32 - DOI - PMC - PubMed

Publication types