

Assessment of iron deposition and white matter maturation in infant brains by using enhanced T2 star weighted angiography (ESWAN): R2* versus phase values
- PMID: 24587101
- PMCID: PMC3934963
- DOI: 10.1371/journal.pone.0089888
Assessment of iron deposition and white matter maturation in infant brains by using enhanced T2 star weighted angiography (ESWAN): R2* versus phase values
Abstract
Background and purpose: Iron deposition and white matter (WM) maturation are very important for brain development in infants. It has been reported that the R2* and phase values originating from the gradient-echo sequence could both reflect the iron and myelination. The aim of this study was to investigate age-related changes of R2* and phase value, and compare their performances for monitoring iron deposition and WM maturation in infant brains.
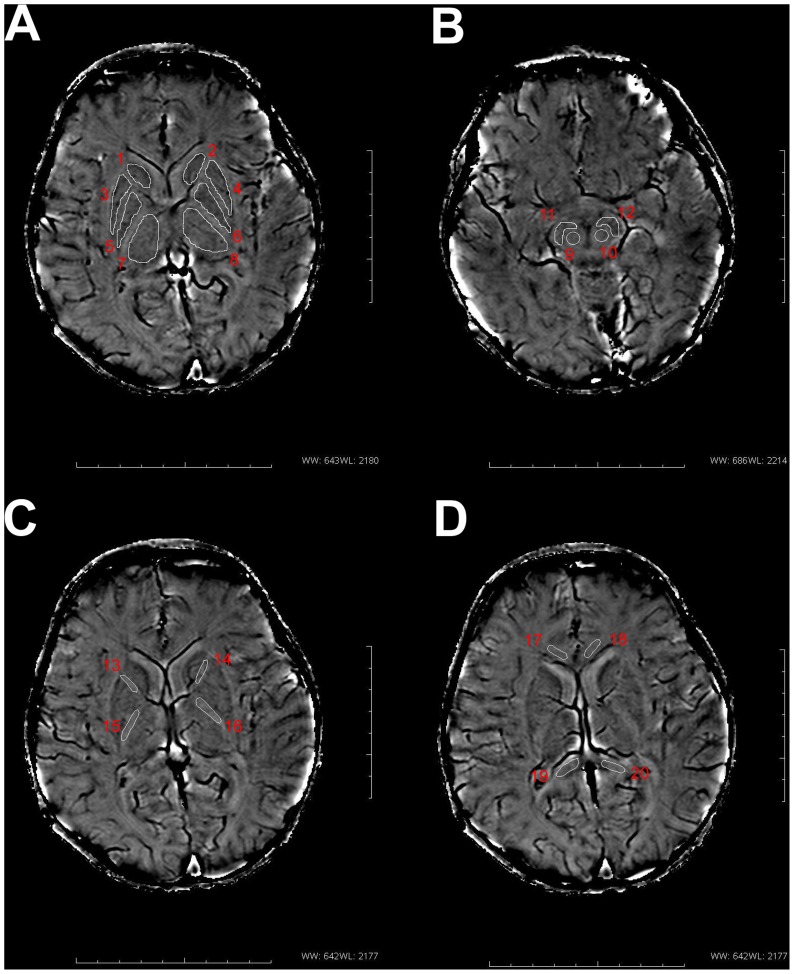
Methods: 56 infants were examined by enhanced T2 star weighted angiography (ESWAN) and diffusion tensor imaging in the 1.5T MRI system. The R2* and phase values were measured from the deep gray nuclei and WM. Fractional anisotropy (FA) values were measured only in the WM regions. Correlation analyses were performed to explore the relation among the two parameters (R2* and phase values) and postmenstrual age (PMA), previously published iron concentrations as well as FA values.
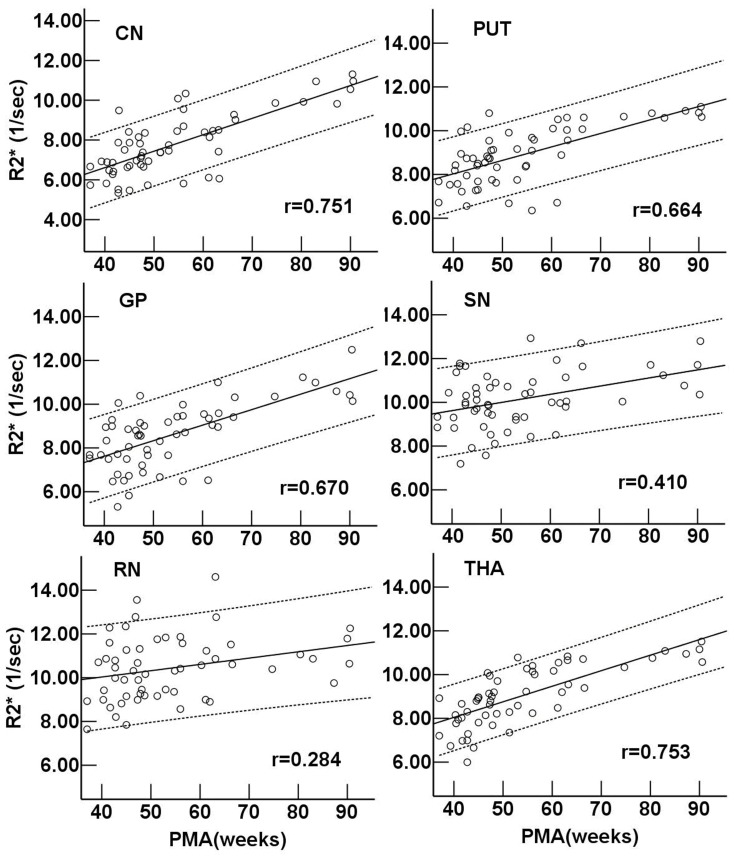
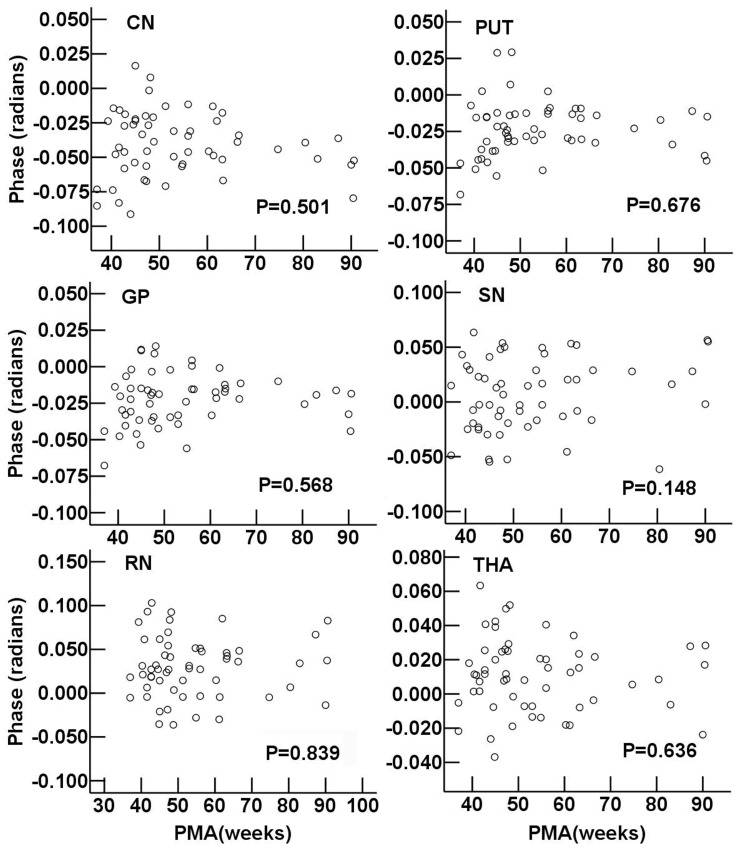
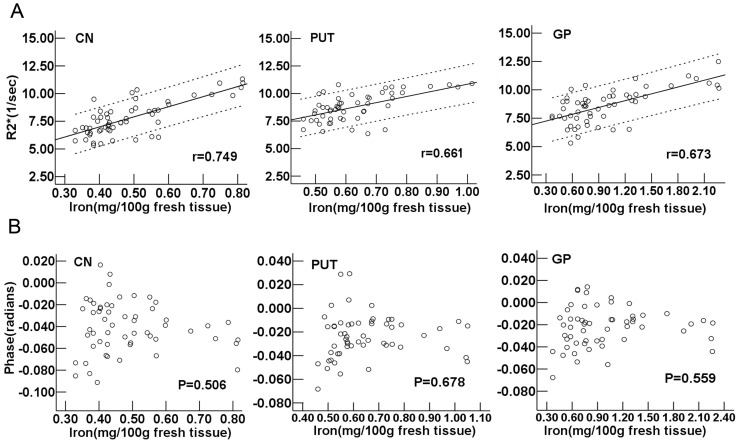
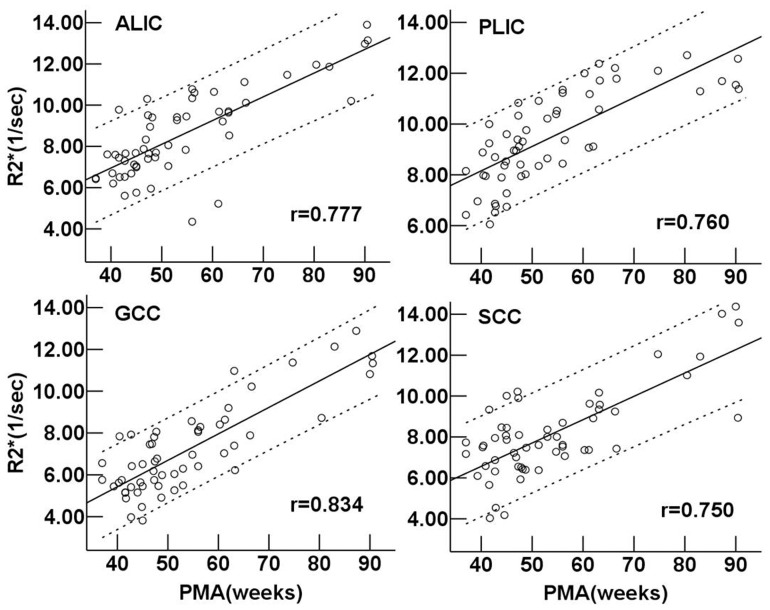
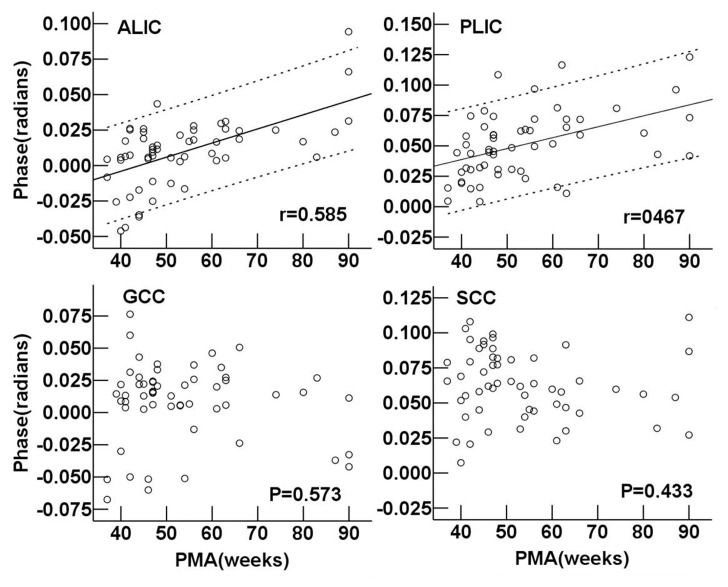
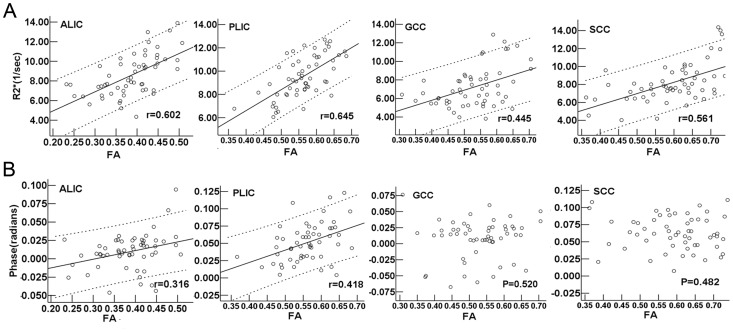
Results: We found significantly positive correlations between the R2* values and PMA in both of the gray nuclei and WM. Moreover, R2* values had a positive correlation with the iron reference concentrations in the deep gray nuclei and the FA in the WM. However, phase values only had the positive correlation with PMA and FA in the internal capsule, and no significant correlation with PMA and iron content in the deep gray nuclei.
Conclusions: Compared with the phase values, R2* may be a preferable method to estimate the iron deposition and WM maturation in infant brains.
Conflict of interest statement
Figures

Similar articles
-
Assessment of brain maturation in the preterm infants using diffusion tensor imaging (DTI) and enhanced T2 star weighted angiography (ESWAN).Eur J Radiol. 2013 Sep;82(9):e476-83. doi: 10.1016/j.ejrad.2013.04.003. Epub 2013 Apr 29. Eur J Radiol. 2013. PMID: 23639775
-
Diffusion tensor imaging assessment of brain white matter maturation during the first postnatal year.AJR Am J Roentgenol. 2007 Aug;189(2):476-86. doi: 10.2214/AJR.07.2132. AJR Am J Roentgenol. 2007. PMID: 17646476
-
Brain microstructural development at near-term age in very-low-birth-weight preterm infants: an atlas-based diffusion imaging study.Neuroimage. 2014 Feb 1;86:244-56. doi: 10.1016/j.neuroimage.2013.09.053. Epub 2013 Oct 1. Neuroimage. 2014. PMID: 24091089 Free PMC article.
-
White Matter Tract Injury by MRI in CADASIL Patients is Associated With Iron Accumulation.J Magn Reson Imaging. 2023 Jan;57(1):238-245. doi: 10.1002/jmri.28301. Epub 2022 Jun 23. J Magn Reson Imaging. 2023. PMID: 35735742
-
The role of diffusion tensor imaging and fractional anisotropy in the evaluation of patients with idiopathic normal pressure hydrocephalus: a literature review.Neurosurg Focus. 2016 Sep;41(3):E12. doi: 10.3171/2016.6.FOCUS16192. Neurosurg Focus. 2016. PMID: 27581308 Review.
Cited by
-
Whole Brain MRI Assessment of Age and Sex-Related R2* Changes in the Human Fetal Brain.Hum Brain Mapp. 2025 Feb 1;46(2):e70073. doi: 10.1002/hbm.70073. Hum Brain Mapp. 2025. PMID: 39844450 Free PMC article.
-
Iron Concentration in Deep Gray Matter Structures is Associated with Worse Visual Memory Performance in Healthy Young Adults.J Alzheimers Dis. 2017;59(2):675-681. doi: 10.3233/JAD-170118. J Alzheimers Dis. 2017. PMID: 28671115 Free PMC article.
-
Evaluation of Renal Oxygenation Level Changes after Water Loading Using Susceptibility-Weighted Imaging and T2* Mapping.Korean J Radiol. 2015 Jul-Aug;16(4):827-34. doi: 10.3348/kjr.2015.16.4.827. Epub 2015 Jul 1. Korean J Radiol. 2015. PMID: 26175582 Free PMC article.
-
Analysis of deep grey nuclei susceptibility in early childhood: a quantitative susceptibility mapping and R2* study at 3 Tesla.Neuroradiology. 2022 May;64(5):1021-1031. doi: 10.1007/s00234-021-02846-0. Epub 2021 Nov 17. Neuroradiology. 2022. PMID: 34787698 Free PMC article.
-
Optimal echo time for functional MRI of the infant brain identified in response to noxious stimulation.Magn Reson Med. 2017 Aug;78(2):625-631. doi: 10.1002/mrm.26455. Epub 2016 Sep 21. Magn Reson Med. 2017. PMID: 27654315 Free PMC article.
References
-
- Aquino D, Bizzi A, Grisoli M, Garavaglia B, Bruzzone MG, et al. (2009) Age-related iron deposition in the basal ganglia: quantitative analysis in healthy subjects. Radiology 252: 165–172. - PubMed
-
- Nitz WR, Reimer P (1999) Contrast mechanisms in MR imaging. Eur Radiol 9: 1032–1046. - PubMed
-
- Vymazal J, Hajek M, Patronas N, Giedd JN, Bulte JW, et al. (1995) The quantitative relation between T1-weighted and T2-weighted MRI of normal gray matter and iron concentration. J Magn Reson Imaging 5: 554–560. - PubMed
-
- Todorich B, Pasquini JM, Garcia CI, Paez PM, Connor JR (2009) Oligodendrocytes and myelination: the role of iron. Glia 57: 467–478. - PubMed
Publication types
MeSH terms
Substances
LinkOut - more resources
Full Text Sources
Other Literature Sources
Medical
