

Use of synthetic isoprenoids to target protein prenylation and Rho GTPases in breast cancer invasion
- PMID: 24587105
- PMCID: PMC3935959
- DOI: 10.1371/journal.pone.0089892
Use of synthetic isoprenoids to target protein prenylation and Rho GTPases in breast cancer invasion
Abstract
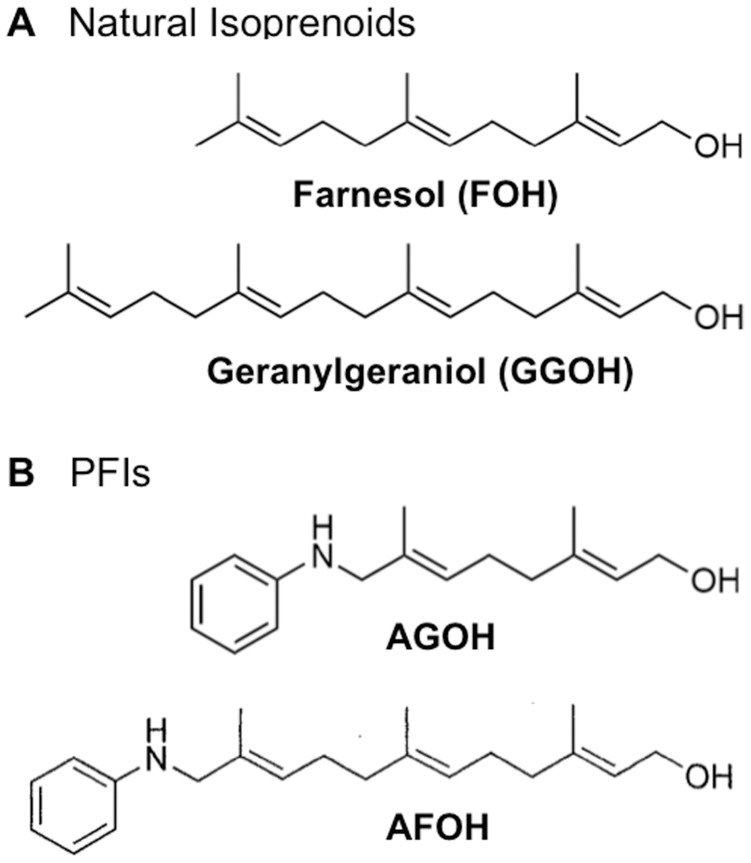
Dysregulation of Ras and Rho family small GTPases drives the invasion and metastasis of multiple cancers. For their biological functions, these GTPases require proper subcellular localization to cellular membranes, which is regulated by a series of post-translational modifications that result in either farnesylation or geranylgeranylation of the C-terminal CAAX motif. This concept provided the rationale for targeting farnesyltransferase (FTase) and geranylgeranyltransferases (GGTase) for cancer treatment. However, the resulting prenyl transferase inhibitors have not performed well in the clinic due to issues with alternative prenylation and toxicity. As an alternative, we have developed a unique class of potential anti-cancer therapeutics called Prenyl Function Inhibitors (PFIs), which are farnesol or geranyl-geraniol analogs that act as alternate substrates for FTase or GGTase. Here, we test the ability of our lead PFIs, anilinogeraniol (AGOH) and anilinofarnesol (AFOH), to block the invasion of breast cancer cells. We found that AGOH treatment effectively decreased invasion of MDA-MB-231 cells in a two-dimensional (2D) invasion assay at 100 µM while it blocked invasive growth in three-dimensional (3D) culture model at as little as 20 µM. Notably, the effect of AGOH on 3D invasive growth was phenocopied by electroporation of cells with C3 exotransferase. To determine if RhoA and RhoC were direct targets of AGOH, we performed Rho activity assays in MDA-MB-231 and MDA-MB-468 cells and found that AGOH blocked RhoA and RhoC activation in response to LPA and EGF stimulation. Notably, the geranylgeraniol analog AFOH was more potent than AGOH in inhibiting RhoA and RhoC activation and invasive growth. Interestingly, neither AGOH nor AFOH impacted 3D growth of MCF10A cells. Collectively, this study demonstrates that AGOH and AFOH dramatically inhibit breast cancer invasion, at least in part by blocking Rho function, thus, suggesting that targeting prenylation by using PFIs may offer a promising mechanism for treatment of invasive breast cancer.
Conflict of interest statement
Figures


Similar articles
-
Inhibition of transendothelial migration and invasion of human breast cancer cells by preventing geranylgeranylation of Rho.Int J Oncol. 2006 Jul;29(1):217-23. Int J Oncol. 2006. PMID: 16773203
-
"Smart" Nanoparticles Enhance the Cytoplasmic Delivery of Anti-RhoC Silencing RNA and Inhibit the Migration and Invasion of Aggressive Breast Cancer Cells.Mol Pharm. 2015 Jul 6;12(7):2406-17. doi: 10.1021/acs.molpharmaceut.5b00114. Epub 2015 May 28. Mol Pharm. 2015. PMID: 26020100
-
Using inhibitors of prenylation to block localization and transforming activity.Methods Enzymol. 2006;407:575-97. doi: 10.1016/S0076-6879(05)07046-1. Methods Enzymol. 2006. PMID: 16757354
-
Inhibitors of prenylation of Ras and other G-proteins and their application as therapeutics.Biochem Pharmacol. 2000 Oct 15;60(8):1061-8. doi: 10.1016/s0006-2952(00)00386-5. Biochem Pharmacol. 2000. PMID: 11007942 Review.
-
RHO GTPase signaling for axon extension: is prenylation important?Mol Neurobiol. 2010 Oct;42(2):133-42. doi: 10.1007/s12035-010-8144-2. Epub 2010 Sep 28. Mol Neurobiol. 2010. PMID: 20878268 Review.
Cited by
-
Understanding the Antilymphoma Activity of Annona macroprophyllata Donn and Its Acyclic Terpenoids: In Vivo, In Vitro, and In Silico Studies.Molecules. 2022 Oct 21;27(20):7123. doi: 10.3390/molecules27207123. Molecules. 2022. PMID: 36296714 Free PMC article.
-
Synthetic isoprenoid analogues for the study of prenylated proteins: Fluorescent imaging and proteomic applications.Bioorg Chem. 2016 Feb;64:59-65. doi: 10.1016/j.bioorg.2015.12.003. Epub 2015 Dec 10. Bioorg Chem. 2016. PMID: 26709869 Free PMC article. Review.
-
Targeting prenylation inhibition through the mevalonate pathway.RSC Med Chem. 2019 Dec 23;11(1):51-71. doi: 10.1039/c9md00442d. eCollection 2020 Jan 1. RSC Med Chem. 2019. PMID: 33479604 Free PMC article. Review.
-
Functional Regulation of an Oxidative Stress Mediator, Rac1, in Diabetic Retinopathy.Mol Neurobiol. 2019 Dec;56(12):8643-8655. doi: 10.1007/s12035-019-01696-5. Epub 2019 Jul 13. Mol Neurobiol. 2019. PMID: 31300985 Free PMC article.
-
Formation of a Novel Macrocyclic Alkaloid from the Unnatural Farnesyl Diphosphate Analogue Anilinogeranyl Diphosphate by 5-Epi-Aristolochene Synthase.ACS Chem Biol. 2015 Jul 17;10(7):1729-36. doi: 10.1021/acschembio.5b00145. Epub 2015 May 4. ACS Chem Biol. 2015. PMID: 25897591 Free PMC article.
References
-
- Siegel R, Naishadham D, Jemal A (2013) Cancer statistics, 2013. CA Cancer J Clin 63: 11–30. - PubMed
-
- DeSantis C, Siegel R, Bandi P, Jemal A (2011) Breast cancer statistics, 2011. CA Cancer J Clin 61: 409–418. - PubMed
-
- Heasman SJ, Ridley AJ (2008) Mammalian Rho GTPases: new insights into their functions from in vivo studies. Nat Rev Mol Cell Biol 9: 690–701. - PubMed
-
- Vega FM, Ridley AJ (2008) Rho GTPases in cancer cell biology. FEBS Lett 582: 2093–2101. - PubMed
-
- Sahai E, Marshall CJ (2002) RHO-GTPases and cancer. Nat Rev Cancer 2: 133–142. - PubMed
Publication types
MeSH terms
Substances
Grants and funding
LinkOut - more resources
Full Text Sources
Other Literature Sources
Medical
Research Materials
Miscellaneous
