. 2014 Feb 24;9(2):e89938.
doi: 10.1371/journal.pone.0089938. eCollection 2014.

Novel inhibitors of mitochondrial sn-glycerol 3-phosphate dehydrogenase

Affiliations

Novel inhibitors of mitochondrial sn-glycerol 3-phosphate dehydrogenase

Adam L Orr et al. PLoS One. .

Abstract

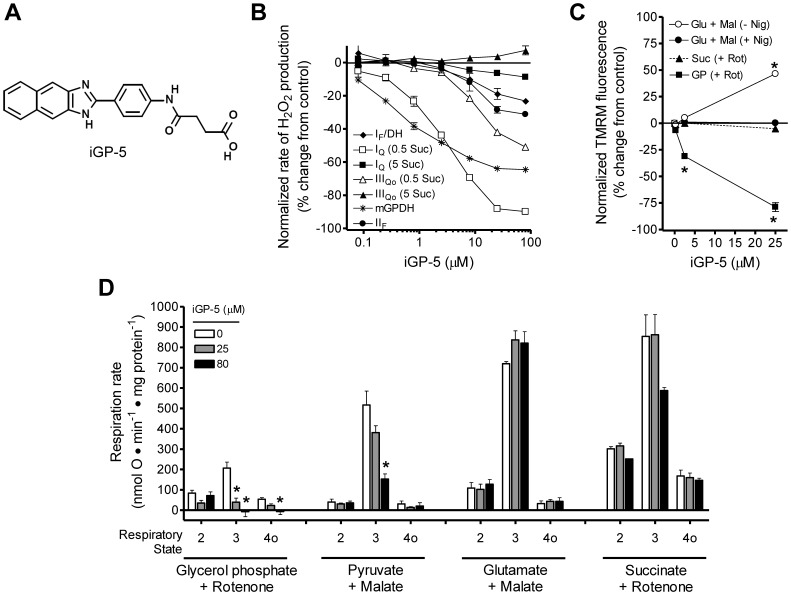
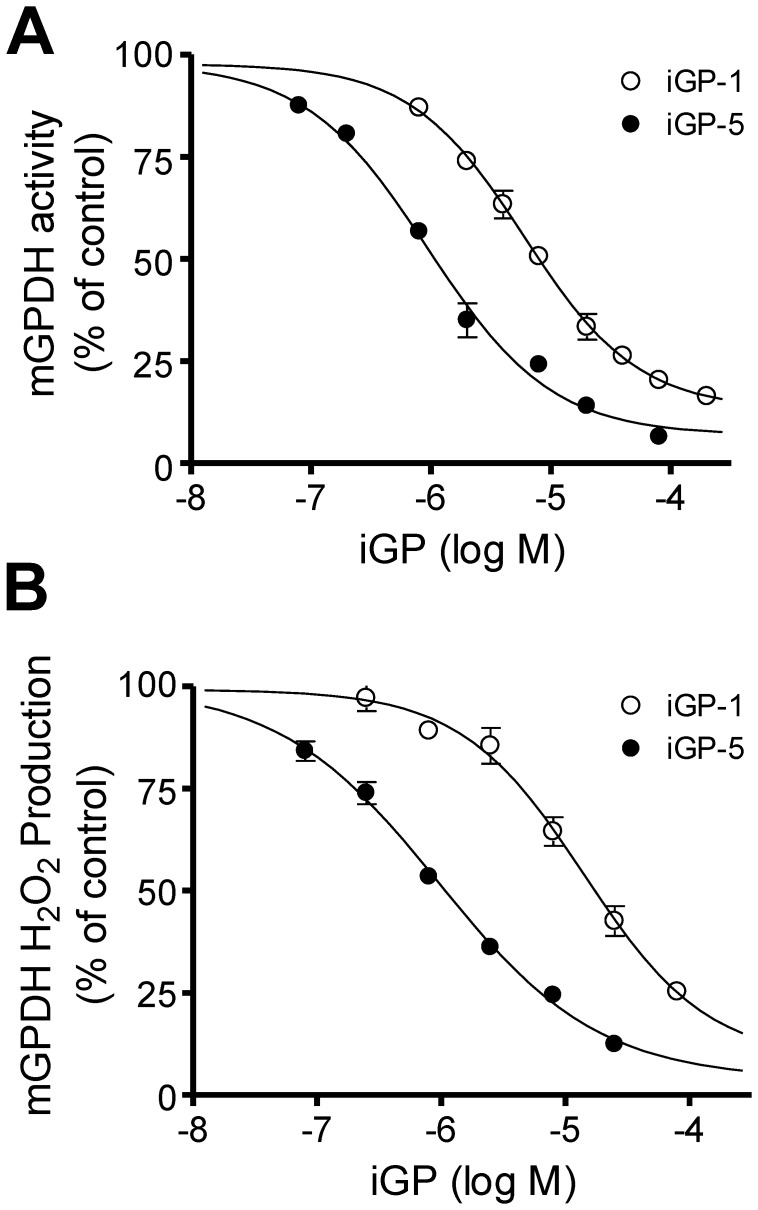
Mitochondrial sn-glycerol 3-phosphate dehydrogenase (mGPDH) is a ubiquinone-linked enzyme in the mitochondrial inner membrane best characterized as part of the glycerol phosphate shuttle that transfers reducing equivalents from cytosolic NADH into the mitochondrial electron transport chain. Despite the widespread expression of mGPDH and the availability of mGPDH-null mice, the physiological role of this enzyme remains poorly defined in many tissues, likely because of compensatory pathways for cytosolic regeneration of NAD⁺ and mechanisms for glycerol phosphate metabolism. Here we describe a novel class of cell-permeant small-molecule inhibitors of mGPDH (iGP) discovered through small-molecule screening. Structure-activity analysis identified a core benzimidazole-phenyl-succinamide structure as being essential to inhibition of mGPDH while modifications to the benzimidazole ring system modulated both potency and off-target effects. Live-cell imaging provided evidence that iGPs penetrate cellular membranes. Two compounds (iGP-1 and iGP-5) were characterized further to determine potency and selectivity and found to be mixed inhibitors with IC₅₀ and K(i) values between ∼1-15 µM. These novel mGPDH inhibitors are unique tools to investigate the role of glycerol 3-phosphate metabolism in both isolated and intact systems.


Conflict of interest statement

Competing Interests: The authors have declared that no competing interests exist.

Figures

Figure 1
Figure 1. The glycerol phosphate shuttle is one of several pathways to regenerate cytosolic NAD+ for glycolysis.
Glycolytic metabolism of glucose to pyruvate involves the reduction of cytosolic NAD+ to NADH at the step catalyzed by glyceraldehyde 3-phosphate dehydrogenase. Several mechanisms exist to regenerate cytosolic NAD+ to ensure that a high NADH/NAD+ ratio does not limit glucose metabolism. (A) The glycerol phosphate shuttle comprises soluble, NAD+-linked cGPDH and the membrane bound, FAD-linked mGPDH. This system regenerates cytosolic NAD+ and transfers the reducing equivalents directly into the mobile ubiquinone pool of the mitochondrial electron transport chain. (B) The malate-aspartate shuttle comprises multiple enzymes and mitochondrial carriers that interconvert and transport dicarboxylates and amino acids. In the cytosol, malate dehydrogenase regenerates NAD+ during reduction of oxaloacetate to malate. This malate is transported into the mitochondrial matrix where it is oxidized back to oxaloacetate by mitochondrial malate dehydrogenase, producing NADH that is reoxidized by complex I of the electron transport chain. To complete the shuttle, cytosolic oxaloacetate is regenerated by sequential transaminations through aspartate. These transaminations are potently inhibited by aminooxyacetate. cMDH, cytosolic malate dehydrogenase; mMDH, mitochondrial malate dehydrogenase; OAA, oxaloacetate; Mal, malate; Asp, aspartate (C) Lactate dehydrogenase regenerates cytosolic NAD+ at the expense of mitochondrial oxidation of pyruvate. LDH, lactate dehydrogenase. In certain systems, such as neuronal synapses, the maintenance of cytosolic NAD+ by each of these mechanisms can be made less important by direct uptake and oxidation of pyruvate.
Figure 2
Figure 2. Small-metabolite inhibitors of mGPDH are not selective.
(A) Effect of DHAP (black circles) and glyceraldehyde 3-phosphate (white circles) on the rate of H2O2 production in the presence of 1.7 mM glycerol phosphate, 4 µM rotenone, 2 µM myxothiazol, 2.5 µM antimycin A, and 250 nM free calcium. The rate of H2O2 production by mGPDH was significantly inhibited by each triose phosphate (*p<0.05 versus buffer control; one-way ANOVA with Newman-Keuls post-test). Data are means ± S.E. (n = 3). (B) Effect of glyceraldehyde 3-phosphate on the rate of H2O2 production from site IQ (triangles; 5 mM succinate), site IIF (circles; 0.5 mM succinate, 4 µM rotenone, 2 µM myxothiazol, 2.5 µM antimycin A), and site IIIQo (squares; 5 mM succinate, 3 mM malonate, 4 µM rotenone, 2.5 µM antimycin A). The rate of H2O2 production by site IIF was significantly inhibited (*p<0.05 versus buffer control; one-way ANOVA with Newman-Keuls post-test). Data are means ± S.E. (n = 3). (C) Effect of glyceraldehyde 3-phosphate on ΔΨm powered by 5 mM glutamate and 5 mM malate (triangles), 5 mM succinate and 4 µM rotenone (circles), or 16.7 mM glycerol phosphate with 4 µM rotenone and 2 µM atpenin A5 (squares) all in the presence of 80 ng ⋅ ml−1 nigericin to collapse ΔpH. ΔΨm powered by glycerol phosphate was significantly decreased at all concentrations of glyceraldehyde 3-phosphate tested. ΔΨm powered by succinate was significantly increased at 2.5 mM glyceraldehyde 3-phosphate. (*p<0.05 versus buffer control; one-way ANOVA with Newman-Keuls post-test). Data are means ± S.E. (n = 3). GAP, glyceraldehyde 3-phosphate; Glu, glutamate; Mal, malate; Suc, succinate; Rot, rotenone; GP, glycerol phosphate; AtA5, atpenin A5. When not visible, error bars are obscured by the symbol.
Figure 3
Figure 3. Screening design for novel inhibitors of mitochondrial H2O2 production.
(A) Screening workflow. Compounds were screened in duplicate in microplates against six assays. Five assays each targeted a distinct site of superoxide/H2O2 production using different substrates without or with inhibitors. The sites assayed were site IQ, site IF/DH, site IIF, site IIIQo, and mGPDH. A sixth assay of ΔΨm was used to eliminate general inhibitors of mitochondrial function. All assays were initiated by the addition of Start Solutions containing the substrates and inhibitors listed in parentheses. Details are in “Materials and Methods” and reference 43. Endpoint fluorescence was measured and the effect of compounds was scaled to positive and negative controls included on each assay plate. (B – G) Average normalized effects of 3200 compounds screened against all six assays in duplicate (gray circles). 87 compounds gave >10% inhibition of mGPDH superoxide/H2O2 production (dashed line in B). However, after evaluating their effects in the other screens, only 7 were selective for superoxide/H2O2 production from mGPDH and did not impair ΔΨm driven with glutamate and malate (red circles in B – G). AUR, resorufin product of Amplex UltraRed oxidation; Suc, succinate; Glu, glutamate; Mal, malate; PalmCarn, palmitoylcarnitine; GP, glycerol 3-phosphate; Rot, rotenone; Ant A, antimycin A; Myx, myxothiazol; Malon, malonate; Nig, nigericin.
Figure 4
Figure 4. Structure/activity analysis identifies features conferring mGPDH inhibition.
Summary of effects on H2O2 production and ΔΨm of 20 compounds structurally related to the top hit in our primary screen. Each compound was tested against eight assays of site-selective H2O2 production and four assays of ΔΨm powered by different mitochondrial substrates (see Materials and Methods for details of individual assays). Data are means of two replicates on the same plate. Five criteria best segregated these compounds according to changes in structural motifs relative to the parent compound iGP-1: potency of inhibition of mGPDH H2O2 production (defined by estimating the IC50 concentration or, where an IC50 could not be calculated, the effect on mGPDH H2O2 production at 80 µM), effect on ΔΨm powered by glycerol phosphate, effect on ΔΨm powered by glutamate plus malate in the absence or presence of the K+/H+ exchanger nigericin, and effect on H2O2 production by site IQ driven by succinate. Note that because the method used to normalize mGPDH H2O2 production in the screening assay underestimated the background rate, the maximal % inhibition for this assay was ∼70% (see Materials and Methods). Glu, glutamate; Mal, malate; Nig, nigericin; Rot, rotenone; GP, glycerol phosphate; Suc, succinate.
Figure 5
Figure 5. iGP-1 selectively inhibits the mitochondrial isoform of GPDH.
Effect of iGP-1 on the enzymatic activities of mGPDH (black circles) and cGPDH (white circles). iGP-1 significantly inhibited mGPDH activity at all concentrations tested. (*p<0.05 versus vehicle control; one-way ANOVA with Newman-Keuls post-test). Data are means ± S.E. (n = 4 for mGPDH, n = 3 for cGPDH).
Figure 6
Figure 6. iGP-1 selectively inhibits mitochondrial oxidation of glycerol phosphate.
(A) Structure of iGP-1. (B) Effect of iGP-1 on rates of H2O2 production from site IF/DH (black diamonds), site IQ (with 0.5 or 5 mM succinate; white and black squares, respectively), site IIIQo (with 0.5 or 5 mM succinate; white and black triangles, respectively), mGPDH (black stars), and site IIF (with 0.5 mM succinate or 15 µM palmitoylcarnitine; white and black circles, respectively) measured in a fluorimeter. Details of the conditions to induce H2O2 production from each site are given in Materials and Methods. iGP-1 inhibits H2O2 production in a site-specific manner from mGPDH. Inhibition of site IQ H2O2 production driven with 0.5 mM succinate alone (white squares) seen at high concentrations of iGP-1 is neither site- nor substrate-selective since site IQ H2O2 production driven with 5 mM succinate (black squares) is not affected and neither site IIF nor site IIIQo H2O2 production driven with 0.5 mM succinate (white circles and triangles) is altered. Data are normalized means ± S.E. (n = 4 for mGPDH, n = 3 for all other sites). (C) Effect of iGP-1 on ΔΨm powered by 5 mM glutamate and 5 mM malate without or with 80 ng ⋅ mL−1 nigericin (white or black circles), 4 µM rotenone and 0.5 or 5 mM succinate (white or black triangles), 1.7 mM glycerol phosphate, 4 µM rotenone, and 250 nM free calcium (white squares), or 16.7 mM glycerol phosphate, 4 µM rotenone, and nominal zero free calcium (black squares). ΔΨm powered by glycerol phosphate was significantly decreased in the presence of 8, 25, and 80 µM iGP-1. ΔΨm powered by 0.5 mM succinate was significantly decreased by 80 µM iGP-1 whereas no effect was seen on ΔΨm powered by 5 mM succinate or by glutamate and malate. (*p<0.05 versus vehicle control; one-way ANOVA with Newman-Keuls post-test). Data are normalized means ± S.E. (n = 3–5). (D) Effect of iGP-1 on the rates of mitochondrial respiration driven by 16.7 mM glycerol phosphate with 4 µM rotenone and 250 nM free calcium, 10 mM pyruvate and 0.5 mM malate, 5 mM glutamate and 5 mM malate, or 5 mM succinate and 4 µM rotenone. Respiratory states 2, 3, and 4o were defined by the sequential additions of substrate, 5 mM ADP, and 0.5 µg ⋅ mL−1 oligomycin, respectively. iGP-1 significantly decreased glycerol phosphate-dependent respiration at 25 and 80 µM without altering respiration on other substrates. (*p<0.05 versus vehicle control; one-way ANOVA with Newman-Keuls post-test). Data are means ± S.E. (n = 3 for pyruvate and malate, n = 5 for all other substrates). No significant effects were observed under any condition with iGP-1 at 2.5 and 8 µM (not shown). Glu, glutamate; Mal, malate; Nig, nigericin; Suc, succinate; PC, palmitoylcarnitine; Rot, rotenone; GP, glycerol phosphate; Ca, calcium. When not visible, error bars are obscured by the symbol.
Figure 7
Figure 7. iGP-5 inhibits mGPDH activity more potently than iGP-1 but is less selective.
(A) Structure of iGP-5. (B) Effect of iGP-5 on rates of H2O2 production from site IF/DH (black diamonds), site IQ (with 0.5 or 5 mM succinate; white and black squares, respectively), site IIIQo (with 0.5 or 5 mM succinate; white and black triangles, respectively), mGPDH (black stars), and site IIF (with 15 µM palmitoylcarnitine; black circles) measured in microplate format. Details of the conditions to induce H2O2 production from each site are given in Materials and Methods. iGP-5 potently inhibits H2O2 production from mGPDH but also causes progressive changes at several other sites of production. Data are normalized means ± ranges (n = 2 technical replicates). (C) Effect of iGP-5 on ΔΨm powered by 5 mM glutamate and 5 mM malate without or with 80 ng ⋅ mL−1 nigericin (white or black circles), 5 mM succinate and 4 µM rotenone (black triangles), or 16.7 mM glycerol phosphate and 4 µM rotenone (black squares). ΔΨm powered by glycerol phosphate was significantly decreased by 2.5 and 25 µM iGP-5. ΔΨm powered by glutamate and malate was significantly increased by 25 µM iGP-5 but only in the absence of nigericin (white circles) suggesting an effect of iGP-5 on the ΔpH component on the proton motive force. (*p<0.05 versus vehicle control; one-way ANOVA with Newman-Keuls post-test). Data are normalized means ± S.E. (n = 3). (D) Effect of iGP-5 on the rates of mitochondrial respiration driven by 16.7 mM glycerol phosphate with 4 µM rotenone and 250 nM free calcium, 10 mM pyruvate and 0.5 mM malate, 5 mM glutamate and 5 mM malate, or 5 mM succinate and 4 µM rotenone. Respiratory states 2, 3, and 4o were defined by the sequential additions of substrate, 5 mM ADP, and 0.5 µg ⋅ mL−1 oligomycin, respectively. iGP-5 significantly decreased glycerol phosphate-dependent state 3 respiration at 25 and 80 µM but also significantly reduced state 3 respiration with pyruvate and malate at 80 µM. (*p<0.05 versus vehicle control; one-way ANOVA with Newman-Keuls post-test). Data are means ± S.E. (n = 3). No significant effects were observed under any condition with iGP-5 at 2.5 and 8 µM (not shown). Glu, glutamate; Mal, malate; Nig, nigericin; Suc, succinate; Rot, rotenone; GP, glycerol phosphate. When not visible, error bars are obscured by the symbol.
Figure 8
Figure 8. iGP-1 is cell-permeant and inhibits mGPDH in intact presynaptic terminals.
(A) Excitation and emission spectra of 0.4 mM iGP-1 with peaks at 342 nm and 378 nm, respectively. (B) Fluorescence of 100 µM iGP-1 in a live STHdhQ7 cell labeled with LysoTracker Red. (C) Fluorescent labeling of acidic vesicles by LysoTracker Red in the same cell shown in (B). Insets in (B and C) highlight colocalization between intense iGP-1 fluorescence and LysoTracker Red labeled vesicles. (D) Fluorescence of 100 µM iGP-1 in a live STHdhQ7 cell pretreated with 250 nM bafilomycin A1. (E) LysoTracker Red fluorescence in the same cell pretreated with bafilomycin A1 as in (D). Scale bar in (B – E) = 10 µm. (F) iGP-1 fluorescence as a function of buffer pH (ex. λ = 342 nm, em. λ = 430 nm). (G) Effect of vehicle control (DMSO, white bars), 100 µM iGP-1 (light gray bars), 0.5 mM aminooxyacetate (dark gray bars), or their combination (black bars) on synaptosomal respiration. Basal respiration was measured in the presence of either 10 mM pyruvate or 15 mM glucose followed by the addition of 5 µM FCCP and 4 µg ⋅ mL−1 oligomycin to induce uncoupled respiration without or with (rightmost condition) 10 mM oxamate. Oxamate was included to minimize regeneration of cytosolic NAD+ by lactate dehydrogenase. Respiration on pyruvate alone was not altered by inhibition of either or both of the NADH shuttle systems. Both basal and uncoupled respiration on glucose was unaffected by iGP-1 alone but significantly decreased by aminooxyacetate alone. Oxamate increased the maximal rate of respiration achieved by glucose alone. In the presence of oxamate, the combination of iGP-1 combined with aminooxyacetate consistently decreased the maximal uncoupled rate compared to aminooxyacetate alone. (*p<0.05 versus vehicle control and iGP-1 alone; one-way ANOVA with Newman-Keuls post-test). Data are means ± S.E. (n = 3 for pyruvate, n = 4 for glucose, n = 5 for glucose ± oxamate). (H) Assignment of the % of maximal respiration that is dependent on the NADH shuttles in the presence of glucose and oxamate. Under this condition of high glycolytic demand, there is a significant dependence upon both the malate-aspartate shuttle and the glycerol phosphate shuttle. (*p<0.05 versus no change from vehicle control; #p<0.05 versus no change from aminooxyacetate). Data are means ±95% C.I. (n = 5). AOA, aminooxyacetate; Pyr, pyruvate; F/O, FCCP with oligomycin; Glu, glucose.
Figure 9
Figure 9. iGP-1 and iGP-5 potently inhibit mGPDH enzymatic activity and H2O2 production.
(A) iGP-5 (black circles) is a more potent inhibitor of mGPDH enzymatic activity than iGP-1 (white circles). IC50 concentrations were 1.0 and 6.0 µM for iGP-5 and iGP-1, respectively. Data are means ± S.E. (error bars) (n = 3–5). (B) iGP-5 (black circles) is a more potent inhibitor of mGPDH H2O2 production than iGP-1 (white circles). IC50 concentrations were 1.0 and 14.2 µM for iGP-5 and iGP-1, respectively. Data are means ± S.E. (error bars) (n = 2–4). When not visible, error bars are obscured by the symbol.
Figure 10
Figure 10. iGP-1 and iGP-5 produce mixed inhibition kinetics.
(A) Effect of co-varying iGP-1 and glycerol phosphate on mGPDH activity. Curves are hyperbolic best-fits of the Michaelis-Menten equation: mGPDH activity = (Vmax ⋅ [Glycerol phosphate]) ⋅ (K m+[Glycerol phosphate])−1. Data are means ± S.E. (n = 3–4). (B) Effect of co-varying iGP-5 and glycerol phosphate on mGPDH activity. Data are means ± S.E. (n = 3–5). (C) Double reciprocal plot of the data in (D). Data are means ± S.E. (n = 3–4). (D) Double reciprocal plot of the data in (E). Data are means ± S.E. (n = 3–5). (E) Effect of iGP-1 (white circles) and iGP-5 (black circles) on the Vmax of mGPDH activity. Vmax values at each concentration of compound were calculated for each experiment using best-fit Michaelis-Menten curves similar to those in (D and E). The dashed line denotes the mean value for the vehicle control. Data are means ± S.E. (error bars) (n = 3–5). (F) Effect of iGP-1 (white circles) and iGP-5 (black circles) on the K m of mGPDH. K m values at each concentration of compound were calculated for each experiment using best-fit Michaelis-Menten curves similar to those in (D and E). The dashed line denotes the mean value for the vehicle control. Data are means ± S.E. (n = 3–5). (G) Scheme for an enzymatic reaction in which enzyme E converts substrate S into product P in the presence of an inhibitor I that displays both competitive and uncompetitive behavior defined by inhibitor dissociation constants K ic and K iu, respectively .

References

    1. Klingenberg M (1970) Localization of the glycerol-phosphate dehydrogenase in the outer phase of the mitochondrial inner membrane. Eur J Biochem 13: 247–252. - PubMed
    1. Yeh JI, Chinte U, Du S (2008) Structure of glycerol-3-phosphate dehydrogenase, an essential monotopic membrane enzyme involved in respiration and metabolism. Proc Natl Acad Sci U S A 105: 3280–3285. - PMC - PubMed
    1. McKenna MC, Waagepetersen HS, Schousboe A, Sonnewald U (2006) Neuronal and astrocytic shuttle mechanisms for cytosolic-mitochondrial transfer of reducing equivalents: Current evidence and pharmacological tools. Biochem Pharmacol 71: 399–407. - PubMed
    1. Wernette ME, Ochs RS, Lardy HA (1981) Ca2+ stimulation of rat liver mitochondrial glycerophosphate dehydrogenase. J Biol Chem 256: 12767–12771. - PubMed
    1. Brown LJ, MacDonald MJ, Lehn DA, Moran SM (1994) Sequence of rat mitochondrial glycerol-3-phosphate dehydrogenase cDNA. Evidence for EF-hand calcium-binding domains. J Biol Chem 269: 14363–14366. - PubMed

Publication types

LinkOut - more resources