

Genetic structure and diversity of the endangered fir tree of Lebanon (Abies cilicica Carr.): implications for conservation
- PMID: 24587219
- PMCID: PMC3937446
- DOI: 10.1371/journal.pone.0090086
Genetic structure and diversity of the endangered fir tree of Lebanon (Abies cilicica Carr.): implications for conservation
Abstract
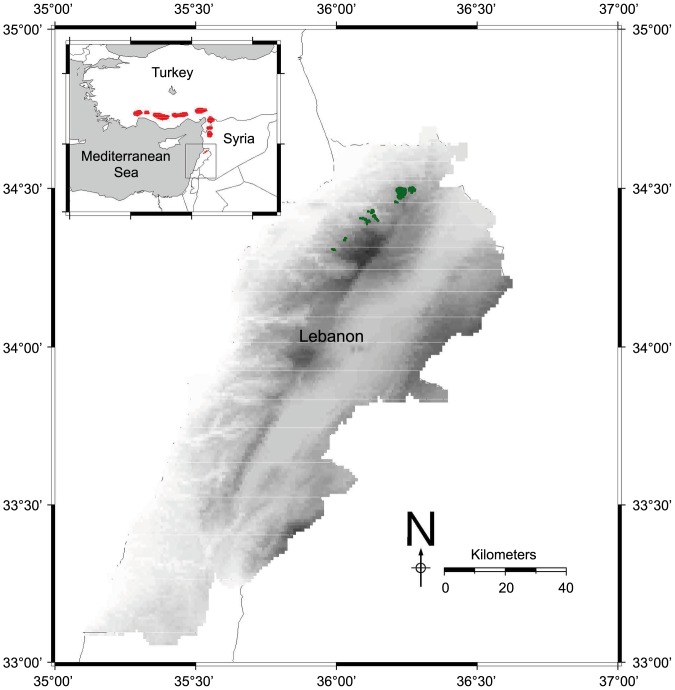
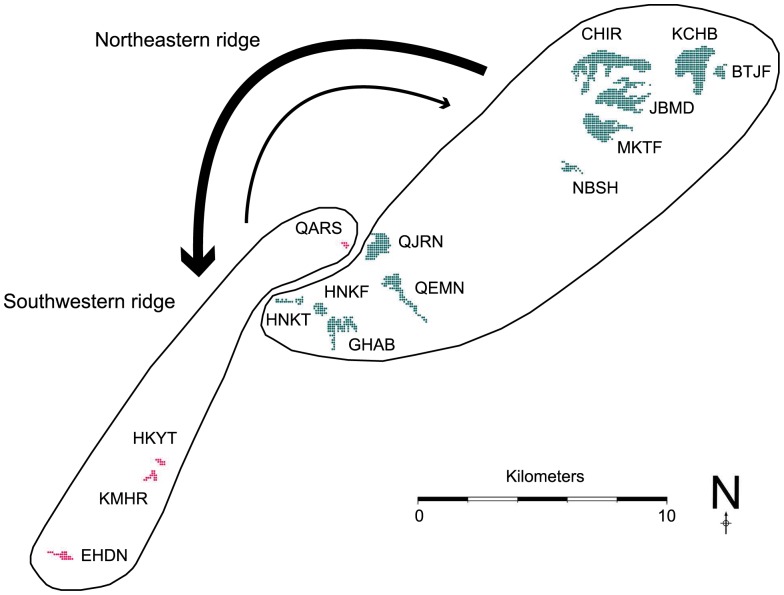
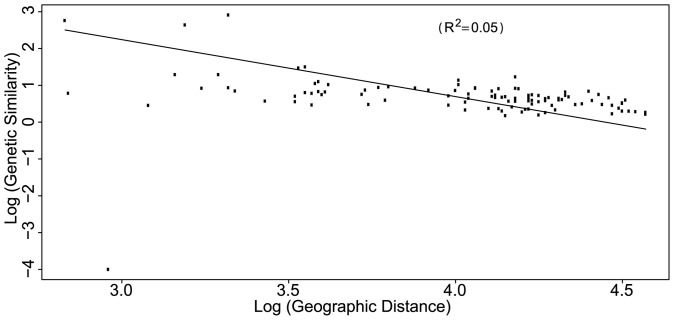
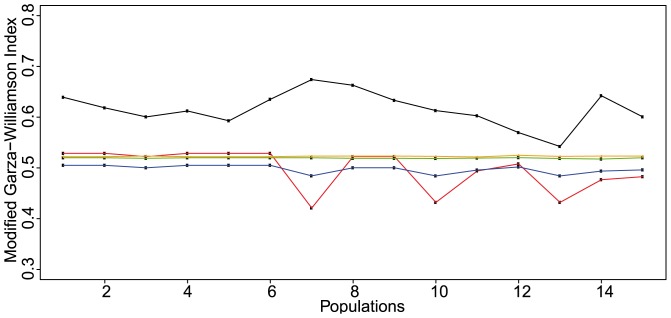
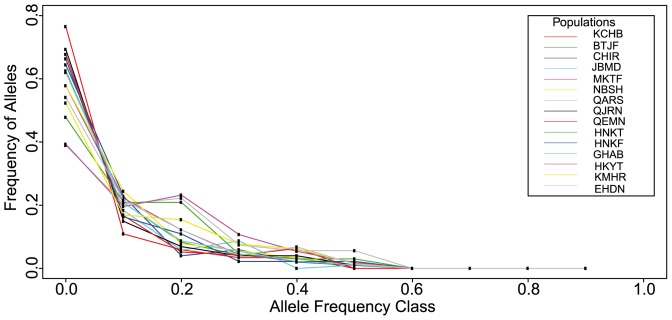
The threatened conifer Abies cilicica currently persists in Lebanon in geographically isolated forest patches. The impact of demographic and evolutionary processes on population genetic diversity and structure were assessed using 10 nuclear microsatellite loci. All remnant 15 local populations revealed a low genetic variation but a high recent effective population size. FST -based measures of population genetic differentiation revealed a low spatial genetic structure, but Bayesian analysis of population structure identified a significant Northeast-Southwest population structure. Populations showed significant but weak isolation-by-distance, indicating non-equilibrium conditions between dispersal and genetic drift. Bayesian assignment tests detected an asymmetric Northeast-Southwest migration involving some long-distance dispersal events. We suggest that the persistence and Northeast-Southwest geographic structure of Abies cilicica in Lebanon is the result of at least two demographic processes during its recent evolutionary history: (1) recent migration to currently marginal populations and (2) local persistence through altitudinal shifts along a mountainous topography. These results might help us better understand the mechanisms involved in the species response to expected climate change.
Conflict of interest statement
Figures
Similar articles
-
Impacts of habitat fragmentation on the genetic diversity of the endangered Guatemalan fir (Abies guatemalensis Rehder).Genetica. 2024 Dec 23;153(1):8. doi: 10.1007/s10709-024-00225-0. Genetica. 2024. PMID: 39714521
-
Nuclear microsatellite primers for the endangered relict fir, Abies pinsapo (Pinaceae) and cross-amplification in related Mediterranean Species.Int J Mol Sci. 2012 Nov 5;13(11):14243-50. doi: 10.3390/ijms131114243. Int J Mol Sci. 2012. PMID: 23203061 Free PMC article.
-
Genetic structure and migration from mainland to island populations in Abies procera Rehd.Genome. 2005 Jun;48(3):461-73. doi: 10.1139/g04-127. Genome. 2005. PMID: 16121243
-
Understanding population structure and historical demography in a conservation context: population genetics of the endangered Kirengeshoma palmata (Hydrangeaceae).Am J Bot. 2014 Mar;101(3):521-9. doi: 10.3732/ajb.1400043. Am J Bot. 2014. PMID: 24650862
-
Population structure and historical demography of Dipteronia dyeriana (Sapindaceae), an extremely narrow palaeoendemic plant from China: implications for conservation in a biodiversity hot spot.Heredity (Edinb). 2017 Aug;119(2):95-106. doi: 10.1038/hdy.2017.19. Epub 2017 Apr 5. Heredity (Edinb). 2017. PMID: 28379211 Free PMC article.
Cited by
-
Population size, center-periphery, and seed dispersers' effects on the genetic diversity and population structure of the Mediterranean relict shrub Cneorum tricoccon.Ecol Evol. 2017 Aug 5;7(18):7231-7242. doi: 10.1002/ece3.2940. eCollection 2017 Sep. Ecol Evol. 2017. PMID: 28944013 Free PMC article.
-
Genetic variation in Tertiary relics: The case of eastern-Mediterranean Abies (Pinaceae).Ecol Evol. 2017 Oct 22;7(23):10018-10030. doi: 10.1002/ece3.3519. eCollection 2017 Dec. Ecol Evol. 2017. PMID: 29238533 Free PMC article.
-
Temporal sampling helps unravel the genetic structure of naturally occurring populations of a phytoparasitic nematode. 2. Separating the relative effects of gene flow and genetic drift.Evol Appl. 2016 Jul 22;9(8):1005-16. doi: 10.1111/eva.12401. eCollection 2016 Sep. Evol Appl. 2016. PMID: 27606008 Free PMC article.
-
Signature of mid-Pleistocene lineages in the European silver fir (Abies alba Mill.) at its geographic distribution margin.Ecol Evol. 2021 Jul 21;11(16):10984-10999. doi: 10.1002/ece3.7886. eCollection 2021 Aug. Ecol Evol. 2021. PMID: 34429896 Free PMC article.
-
Lebanon Biogeography Outlined by Tree and Shrub Species Distribution Pattern.Ecol Evol. 2025 Mar 19;15(3):e71161. doi: 10.1002/ece3.71161. eCollection 2025 Mar. Ecol Evol. 2025. PMID: 40109555 Free PMC article.
References
-
- Billington HL (1991) Effect of population size on genetic variation in a dioecious conifer. Conserv Biol 5: 115–119.
-
- Scaltsoyiannes A, Tsaktsira M, Drouzas AD (1999) Allozyme differentiation in the Mediterranean firs (Abies, Pinaceae). A first comparative study with phylogenetic implications. Plant Syst Evol 216: 289–307.
-
- Liepelt S, Mayland-Quellhorst E, Lahme M, Ziegenhagen B (2010) Contrasting geographical patterns of ancient and modern genetic lineages in Mediterranean Abies species. Plant Syst Evol 284: 141–151.
-
- Fady B, Conkle MT (1993) Allozyme variation and possible phylogenetic implications in Abies cephalonica Loudon and some related Eastern Mediterranean firs. Silvae Genet 42: 351–359.
-
- Parducci L, Szmidt AE, Madaghiele A, Anzidei M, Vendramin GG (2001) Genetic variation at chloroplast microsatellites (cpSSRs) in Abies nebrodensis (Lojac.) Mattei and three neighboring Abies species. Theor Appl Genet 102: 733–740.
Publication types
MeSH terms
LinkOut - more resources
Full Text Sources
Other Literature Sources
Miscellaneous
