. 2014 Feb 21;9(2):e90273.
doi: 10.1371/journal.pone.0090273. eCollection 2014.

Intracellular Acid-extruding regulators and the effect of lipopolysaccharide in cultured human renal artery smooth muscle cells

Affiliations

Intracellular Acid-extruding regulators and the effect of lipopolysaccharide in cultured human renal artery smooth muscle cells

Shih-Hurng Loh et al. PLoS One. .

Abstract

Homeostasis of the intracellular pH (pHi) in mammalian cells plays a pivotal role in maintaining cell function. Thus far, the housekeeping Na(+)-H(+) exchanger (NHE) and the Na(+)-HCO3(-) co-transporter (NBC) have been confirmed in many mammalian cells as major acid extruders. However, the role of acid-extruding regulators in human renal artery smooth muscle cells (HRASMCs) remains unclear. It has been demonstrated that lipopolysaccharide (LPS)-induced vascular occlusion is associated with the apoptosis, activating calpain and increased [Ca(2+)]i that are related to NHE1 activity in endothelia cells. This study determines the acid-extruding mechanisms and the effect of LPS on the resting pHi and active acid extruders in cultured HRASMCs. The mechanism of pHi recovery from intracellular acidosis (induced by NH4Cl-prepulse) is determined using BCECF-fluorescence in cultured HRASMCs. It is seen that (a) the resting pHi is 7.19 ± 0.03 and 7.10 ± 0.02 for HEPES- and CO2/HCO3(-)- buffered solution, respectively; (b) apart from the housekeeping NHE1, another Na(+)-coupled HCO3(-) transporter i.e. NBC, functionally co-exists to achieve acid-equivalent extrusion; (c) three different isoforms of NBC: NBCn1 (SLC4A7; electroneutral), NBCe1 (SLC4A4; electrogenic) and NBCe2 (SLC4A5), are detected in protein/mRNA level; and (d) pHi and NHE protein expression/activity are significantly increased by LPS, in both a dose- and time- dependent manner, but NBCs protein expression is not. In conclusion, it is demonstrated, for the first time, that four pHi acid-extruding regulators: NHE1, NBCn1, NBCe1 and NBCe2, co-exist in cultured HRASMCs. LPS also increases cellular growth, pHi and NHE in a dose- and time-dependent manner.


Conflict of interest statement

Competing Interests: The authors have declared that no competing interests exist.

Figures

Figure 1
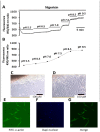
Figure 1. In situ calibration of intracellular pH, purity and identification of human renal artery smooth muscle cells.
A & B: In situ intracellular pH calibration curve in human renal artery smooth muscles cells (HRASMCs). A: The trace shows the BCECF fluorescence (510 nm emission at 490 nm and 440 nm excitations) in HRASMCs. (Please see Materials and Methods for details). B: The curve shows data pooled from 6 similar experiments shown in A. C & D: Phase-contrast micrographs of cultured HRASMCs (10×40), using explant technique. Cell cultured at the 10th day (C) and 20 days (D). The dark black area at the left top corner is the renal artery tissue. The bar below represents a length of 100 μm. E, F & G: Micrographs of immunohistochemistry of HRASMCs. E: HRASMCs stained for the anti-smooth muscle alpha actin (green). F: HRASMCs counterstained with DAPI for nuclei (blue). G: A merge micrograph that combines micrograph E and micrograph F (10×40).
Figure 2
Figure 2. Effect of Na+-free and 30 μM HOE 694 on pHi recovery from induced acidosis (evidence of Na+-H+ exchanger) in HRASMCs superfused with HEPES-buffered Tyrode solution.
A: Top bar shows buffer system used in the superfusate. The periods of application of NH4Cl and tested drugs (30 μM HOE 694, a NHE exchanger inhibitor, and Na+-free solution) are indicated with bars above or below the trace. The left part of trace A show a typical recovery of pHi-recovery from an intracellular acidosis induced by a 10 min NH4Cl (20 mM) pre-pulse in HEPES-buffered Tyrode solution (pHo  = 7.4, 37°C) in HRASMCs. For details of the mechanism of the pre-pulse technique, please see the Materials and Methods section. The right part of trace A represents experiments showing the effect of Na+-free and 30 μM HOE 694 on pHi recovery, respectively, in HRASMCs. B: Histograms, showing the pHi recovery slope of acid extrusion after NH4Cl-induced intracellular acidosis averaged for 6 experiments similar to those shown in A. *: p<0.01 vs. control.
Figure 3
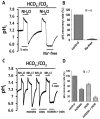
Figure 3. Effect of 30 μM HOE 694, Na+-free and 0.2 mM DIDS on pHi recovery from induced acidosis in HRASMCs superfused with 5% CO2/HCO3 Tyrode solution.
A and C: The top bar shows the buffer system used in the superfusate. The periods of application of NH4Cl and tested drugs (30 μM HOE 694, Na+-free solution, 0.2 mM DIDS and HOE 694 pulse DIDS) are shown with bars above or below the trace. The left part of traces A and C shows a typical pHi recovery from an intracellular acidosis induced by a 10 min NH4Cl (20 mM) pre-pulse in 5% CO2/HCO3 Tyrode solution (pHo  = 7.4, 37°C) in HRASMCs. For details of mechanism of the pre-pulse technique, please see the Materials and Methods section. The right part of traces A and C represents experiments showing the effect of 30 μM HOE 694 (a NHE exchanger inhibitor), Na+-free solution 0.2 mM DIDS (a NBC exchanger inhibitor) and HOE 694 plus DIDS on pHi recovery, respectively, in HRASMCs. B and D: Histograms, showing the pHi recovery slope of acid extrusion after NH4Cl-induced intracellular acidosis averaged for several experiments similar to those shown in A and C respectively. **: p<0.01 vs. control.
Figure 4
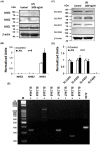
Figure 4. The effect of LPS on protein expression of NHE, NBC and intracellular resting pH in HRASMCs.
A: The figure shows the result of Western blot analysis for β-actin, NHE 1, 2 and 3, from the bottom to the top, respectively, before (left part) and after (right part) the 1000 ng/ml LPS treatment (n = 4). B: The histogram shows relative protein expression, as an average of 6 experiments, which is similar to that shown in A. Data is shown as the mean ± SEM (p<0.01; n = 6). C: The figure shows the result of Western blot analysis for β-actin, SLC4A8 (NBCBE), SLC4A7 (NBCn1), SLC4A5 (NBCe2) and SLC4A4 (NBCe1), from the bottom to the top, respectively, before (left part) and after (right part) the 1000 ng/ml LPS treatment (n = 4). D: The histogram shows the protein expression, as an average of 4 experiments, which is similar to that shown in C. Data is shown as the mean ± SEM (p<0.01; n = 4). E: Gene expression of mRNA of different members of SLC4 family: NBCe1 (SLC4A4; 336 bp), NBCe2 (SLC4A5; 650 bp and 1 kb), NBCn1 (SLC4A7; 328 bp) and NDCBE1 (SLC4A8; 243 bp) extracted from HRASMCs by RT-PCR. Actin expression was used as control (373 bp). bp denotes base pairs; M denotes marker; + denotes the presence of template; − denotes the absence of template (negative control).
Figure 5
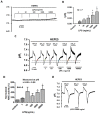
Figure 5. Effect of lipopolysaccharides (LPS) on resting pHi and NHE activity in HRASMCs superfused with HEPES-buffered Tyrode solution.
A, C, E: The top bar shows the buffer system used in the superfusate. The periods of application of NH4Cl and LPS (1∼10000 ng/ml) are shown with bars above or below the trace. Traces A represents experiments showing the effect of different concentrations of LPS (1∼10000 ng/ml) on resting pHi in HEPES-buffered Tyrode solution in HRASMCs (pHo  = 7.4, 37°C). The left part of traces C and E shows a typical pHi recovery from an intracellular acidosis induced by a 7 min NH4Cl (20 mM) pre-pulse in HEPES-buffered solution (pHo  = 7.4, 37°C) in HRASMCs. The right part of traces C and E represents experiment showing the effect of different concentrations of LPS (1∼10000 ng/ml) on pHi recovery in HRASMCs. B, D: Histograms, showing the change in resting pHi and pHi recovery slope of acid extrusion after NH4Cl-induced intracellular acidosis averaged for 7 and 6 experiments similar to those shown in A and C (measured at the range between the two dash lines of the figure), respectively. *: p<0.01 vs. control.
Figure 6
Figure 6. Effect of lipopolysaccharides (LPS) on NBC activity in HRASMCs superfused with 5% CO2/HCO3 Tyrode solution plus 30 μM HOE 694.
The top bar shows the buffer system used in the superfusate. The periods of application of NH4Cl and LPS (1000 and 10000 ng/ml) are shown with bars above or below the trace. The left part of traces shows a typical pHi recovery from an intracellular acidosis induced by a NH4Cl (20 mM) pre-pulse in 5% CO2/HCO3 Tyrode solution plus 30 μM HOE 694 (pHo  = 7.4, 37°C) in HRASMCs. The middle part of trace represents experiment showing the effect of 2 different concentrations of LPS (1000 ng/ml and 10000 ng/ml) on pHi recovery in HRASMCs.
Figure 7
Figure 7. Viability effect of lipopolysaccharides (LPS) in different concentrations in HRASMC.
HRASMC were incubated with different concentration of LPS (1∼10000 ng/ml) for 24 hr. Supernatants for MTT measurement were taken at 24 hr before and after the LPS challenge. Data were mean ± standard error (n = 5∼6). *p<0.05 vs. control, **p<0.001 vs. control.
Figure 8
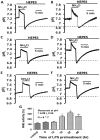
Figure 8. Time-dependent effect of lipopolysaccharides (LPS) on NHE activity in HRASMCs.
A∼F: HRASMCs were incubated with different LPS (1000 ng/ml) for 0, 6, 12, 18, 24 and 48 hr, respectively. Cells were subjects to perform NH4Cl pre-pulse method to detect the NHE activity. Top bar shows the buffer system used in the superfusate. The periods of application of NH4Cl and tested LPS (1000 ng/ml) are shown by the bars below or above the traces. Traces A shows a typical pHi recovery from an intracellular acidosis induced by a 10 min NH4Cl (20 mM) pre-pulse in HEPES-buffered solution (pHo  = 7.4, 37°C) in HRASMCs. Traces B∼F represent experiments showing the time-dependent effect of LPS (6, 12, 18, 24 and 48 hr, respectively) on NHE activity in HRASMCs. G: Histogram, shows acid extrusion after acid loading estimated at pHi 6.88±0.06, averaged for several experiments similar like that of A∼F, respectively. **p<0.01 vs. control.

Similar articles

Cited by

References

    1. Jacobson HR (1988) Ischemic renal disease: an overlooked clinical entity? Kidney Int 34: 729–743. - PubMed
    1. Zoccali C, Mallamaci F, Finocchiaro P (2002) Atherosclerotic renal artery stenosis: epidemiology, cardiovascular outcomes, and clinical prediction rules. J Am Soc Nephrol 13: S179–183. - PubMed
    1. Vashist A, Heller EN, Brown EJ Jr, Alhaddad IA (2002) Renal artery stenosis: a cardiovascular perspective. Am Heart J 143: 559–564. - PubMed
    1. Manjunath G, Tighiouart H, Ibrahim H, MacLeod B, Salem DN, et al. (2003) Level of kidney function as a risk factor for atherosclerotic cardiovascular outcomes in the community. J Am Coll Cardiol 41: 47–55. - PubMed
    1. Conlon PJ, Little MA, Pieper K, Mark DB (2001) Severity of renal vascular disease predicts mortality in patients undergoing coronary angiography. Kidney Int 60: 1490–1497. - PubMed

Publication types

MeSH terms

LinkOut - more resources