

Twelve years of change in coastal upwelling along the central-northern coast of Chile: spatially heterogeneous responses to climatic variability
- PMID: 24587310
- PMCID: PMC3938675
- DOI: 10.1371/journal.pone.0090276
Twelve years of change in coastal upwelling along the central-northern coast of Chile: spatially heterogeneous responses to climatic variability
Abstract
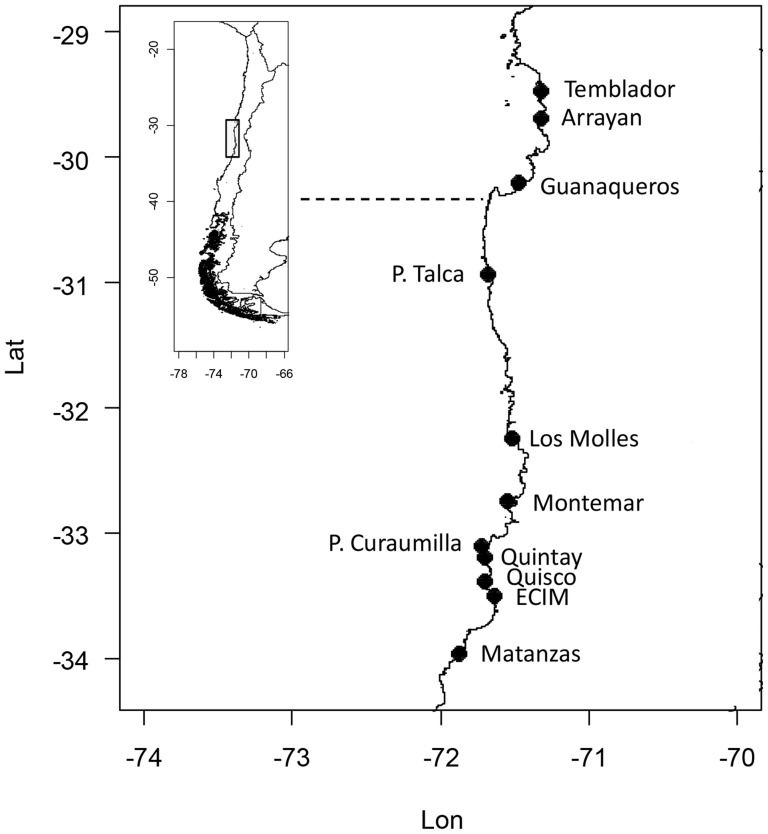
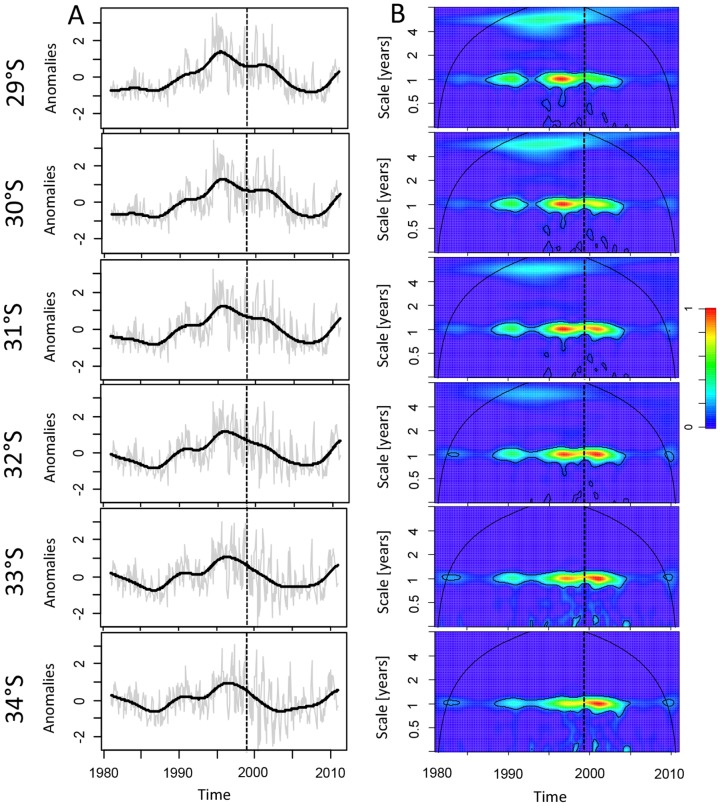
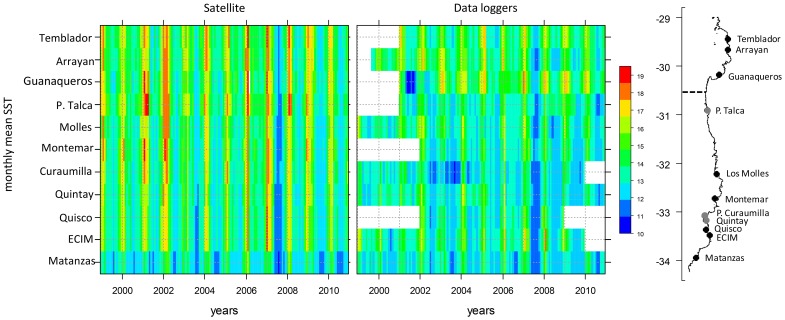
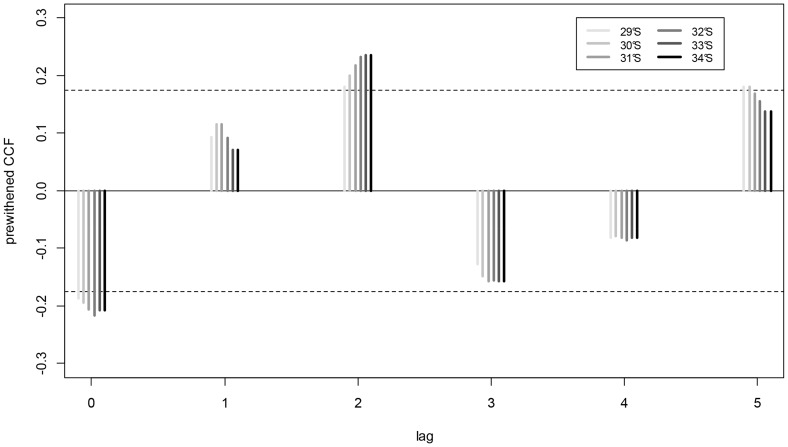
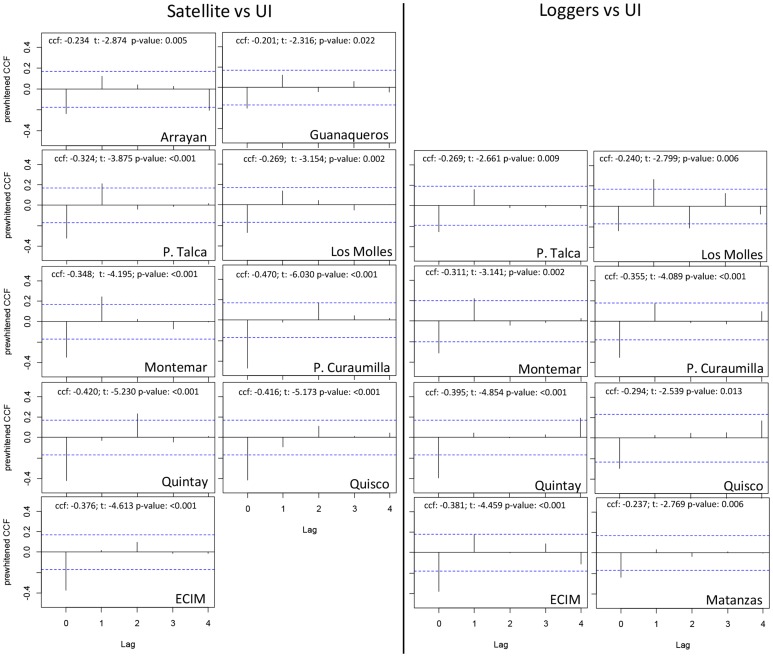
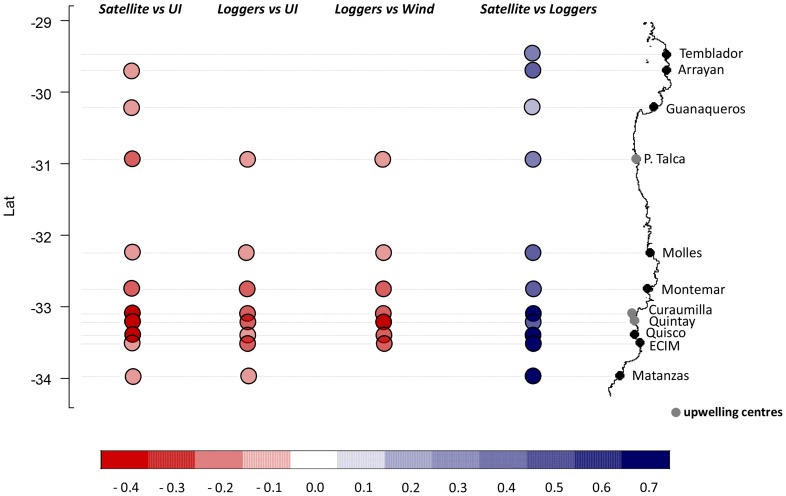
We use time-series analyses to characterize the effects of recent climate variability upon the local physical conditions at 11 study sites along the northern-central coast of Chile (29-34°S). Environmental indices show that the 1° Bakun upwelling index in this coastal region has fluctuated in time, starting from a stable period around the 1980's, peaking during the mid 90s, decreasing during the next ten years and increasing at a steep rate since 2010. Upwelling intensity decreased with increasing latitude, showing also a negative correlation with climate patterns (El Niño3 sea surface temperature-SST anomalies and the Multivariate El Niño Index). We hypothesize that the impacts of climate variability on upwelling events seem to be spatially heterogeneous along the region. Non-sheltered locations and, particularly, sites on prominent headlands show an immediate (lag = 0) and negative correlation between local SST, upwelling events and wind stress. We suggest that near-shore thermal conditions are closely coupled to large-scale forcing of upwelling variability and that this influence is modulated through local topographic factors.
Conflict of interest statement
Figures
Similar articles
-
Climatic control of upwelling variability along the western North-American coast.PLoS One. 2012;7(1):e30436. doi: 10.1371/journal.pone.0030436. Epub 2012 Jan 19. PLoS One. 2012. PMID: 22276199 Free PMC article.
-
Sea Surface Temperature Influence on Terrestrial Gross Primary Production along the Southern California Current.PLoS One. 2015 Apr 29;10(4):e0125177. doi: 10.1371/journal.pone.0125177. eCollection 2015. PLoS One. 2015. PMID: 25923109 Free PMC article.
-
Ocean circulation along the southern Chile transition region (38°-46°S): Mean, seasonal and interannual variability, with a focus on 2014-2016.Prog Oceanogr. 2019 Mar;172:159-198. doi: 10.1016/j.pocean.2019.01.004. Epub 2019 Jan 15. Prog Oceanogr. 2019. PMID: 33204044 Free PMC article.
-
Sea surface temperature variability: patterns and mechanisms.Ann Rev Mar Sci. 2010;2:115-43. doi: 10.1146/annurev-marine-120408-151453. Ann Rev Mar Sci. 2010. PMID: 21141660 Review.
-
El Niño physics and El Niño predictability.Ann Rev Mar Sci. 2014;6:79-99. doi: 10.1146/annurev-marine-010213-135026. Ann Rev Mar Sci. 2014. PMID: 24405425 Review.
Cited by
-
Unexpected population fragmentation in an endangered seabird: the case of the Peruvian diving-petrel.Sci Rep. 2019 Feb 14;9(1):2021. doi: 10.1038/s41598-019-38682-9. Sci Rep. 2019. PMID: 30765805 Free PMC article.
-
Lineage divergence, local adaptation across a biogeographic break, and artificial transport, shape the genetic structure in the ascidian Pyura chilensis.Sci Rep. 2017 Mar 16;7:44559. doi: 10.1038/srep44559. Sci Rep. 2017. PMID: 28300177 Free PMC article.
-
Genetic and morphological divergence at a biogeographic break in the beach-dwelling brooder Excirolana hirsuticauda Menzies (Crustacea, Peracarida).BMC Evol Biol. 2019 Jun 11;19(1):118. doi: 10.1186/s12862-019-1442-z. BMC Evol Biol. 2019. PMID: 31185884 Free PMC article.
-
The complete genome sequence and analysis of vB_VorS-PVo5, a Vibrio phage infectious to the pathogenic bacterium Vibrio ordalii ATCC-33509.Stand Genomic Sci. 2016 Jul 4;11:45. doi: 10.1186/s40793-016-0166-6. eCollection 2016. Stand Genomic Sci. 2016. PMID: 27382430 Free PMC article.
-
Signatures of local adaptation in the spatial genetic structure of the ascidian Pyura chilensis along the southeast Pacific coast.Sci Rep. 2020 Aug 24;10(1):14098. doi: 10.1038/s41598-020-70798-1. Sci Rep. 2020. PMID: 32839518 Free PMC article.
References
-
- Chavez FP, Bertrand A, Guevara-Carrasco R, Soler P, Csirke J (2008) The northern Humboldt Current system: brief history, present status and a view towards the future. Prog Oceanogr 79: 95–105.
-
- Bakun A (1990) Global climate change and intensification of coastal ocean upwelling. Science 247: 198–201. - PubMed
-
- Arntz WE, Gallardo VA, Gutiérrez D, Isla E, Levin LA, et al. (2006) El Niño and similar perturbation effects on the benthos of the Humboldt, California, and Benguela Current upwelling ecosystems. Adv Geosci 6: 243–265.
-
- Thiel M, Macaya EC, Acuña E, Arntz WE, Bastias H, et al. (2007) The Humboldt Current System of northern and central Chile. Oceanogr. Mar Biol 45: 195–344.
-
- Escribano R, Morales CE (2012) Spatial and temporal scales of variability in the coastal upwelling and coastal transition zones off central-southern Chile (35–40°S). Progr Oceanogr 92(1): 1–7.
Publication types
MeSH terms
LinkOut - more resources
Full Text Sources
Other Literature Sources
