Randomized Controlled Trial
. 2014 Feb 28;9(2):e90457.
doi: 10.1371/journal.pone.0090457. eCollection 2014.

Complexity of central processing in simple and choice multilimb reaction-time tasks

Affiliations
Randomized Controlled Trial

Complexity of central processing in simple and choice multilimb reaction-time tasks

Matthieu P Boisgontier et al. PLoS One. .

Abstract

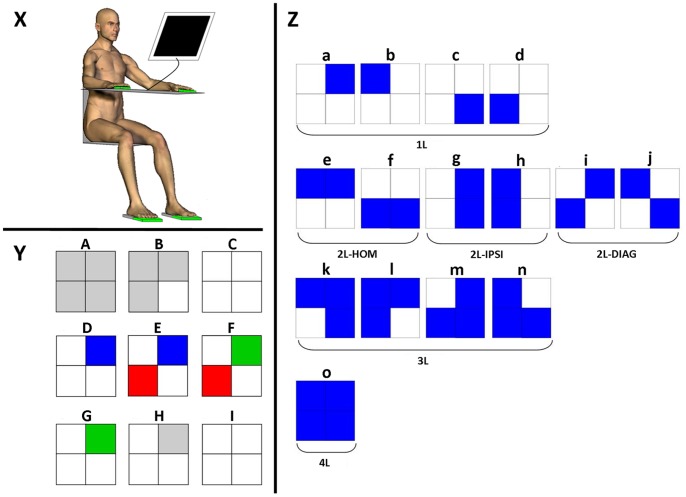
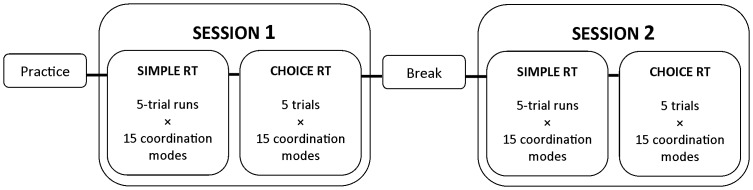
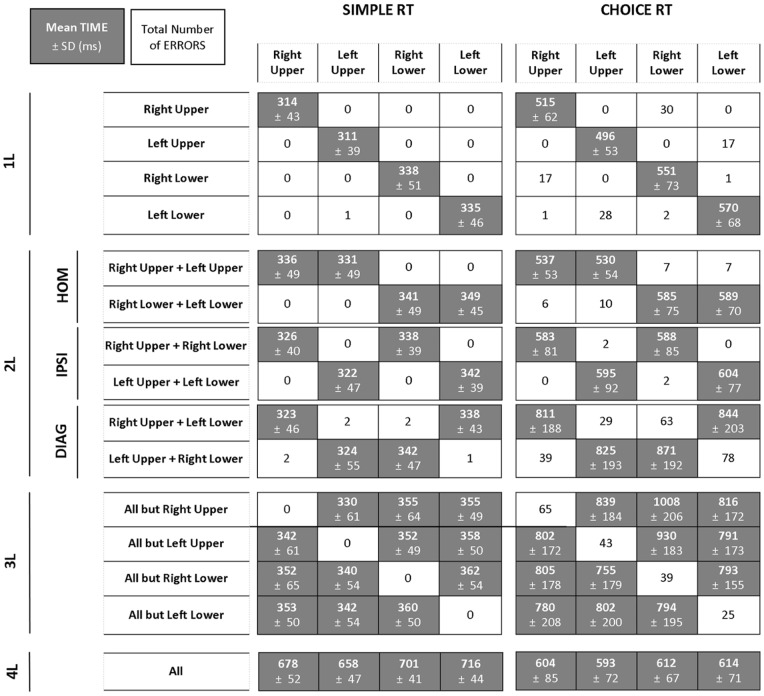
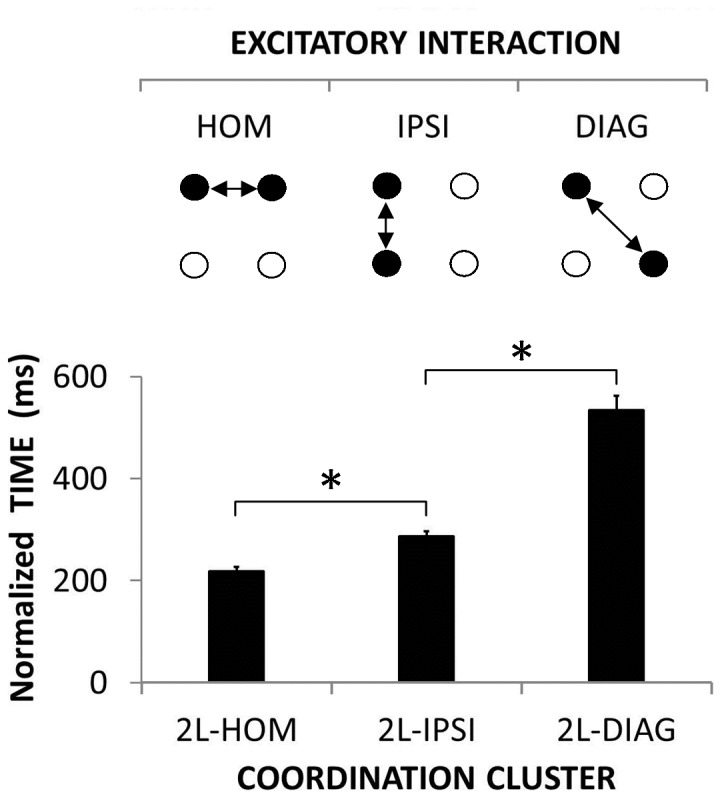
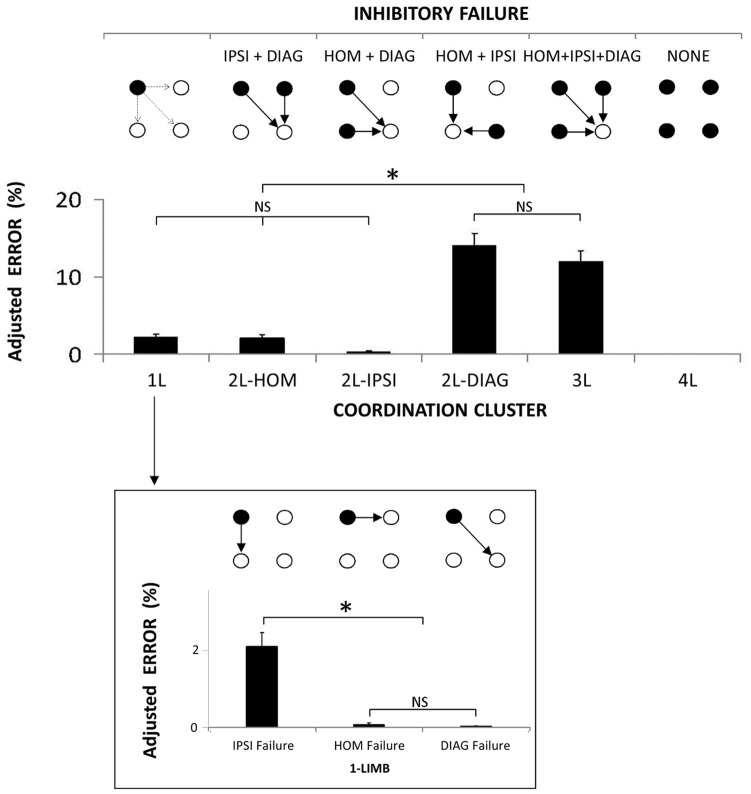
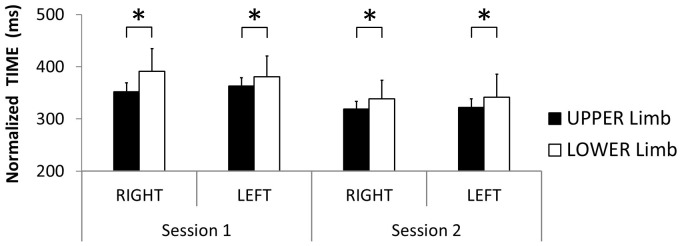
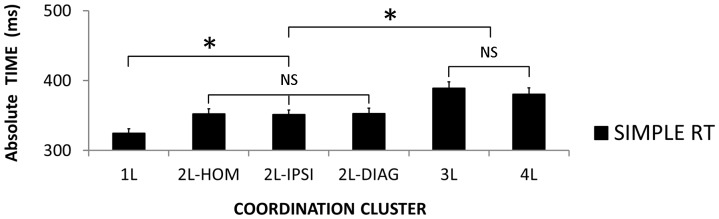
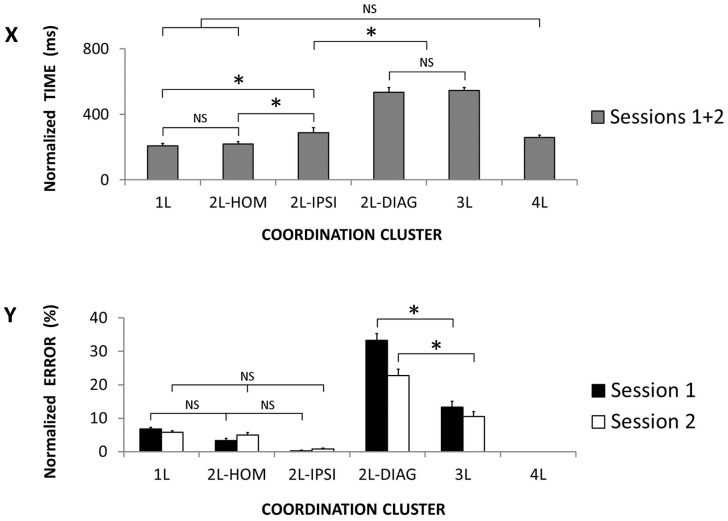
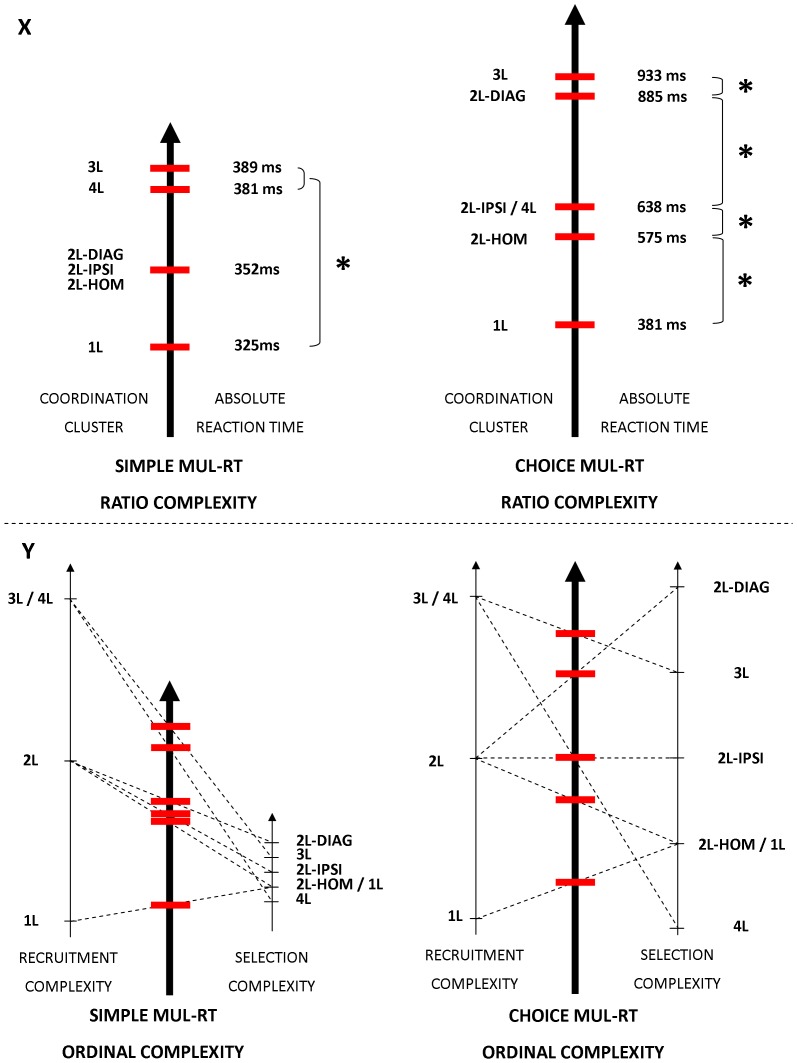
The default mode of the motor system is a coupling between limbs. However, in some movements, a decoupling is required and thus calls for selection and facilitation/inhibition processes. Here, we investigate the relative contribution of recruitment versus selection processes to the overall processing complexity. To this aim we proposed a new multilimb reaction-time task (MUL-RT). Simple, choice and normalized (choice minus simple) RT were analysed together with error rates in thirty-six young adults for 15 coordination modes including all possible configuration of limb recruitment. Simple and normalized RTs were respectively assumed to be indicative of the recruitment and selection processes. Results supported a model of coupling/decoupling interactions respectively reporting weak, intermediate and strong interaction for selecting diagonal, ipsilateral and homologous limbs. Movement laterality (left vs. right) had no effect on selection complexity, whereas selecting upper limbs was less challenging than selecting lower limbs. Results in the different coordination modes suggested that recruitment complexity decreased as follows: 3 limbs = 4 limbs>2 limbs (homologous, ipsilateral and diagonal)>1 limb, and selection complexity as follows: 2 diagonal limbs>3 limbs>2 ipsilateral limbs>1 limb = 2 homologous limbs>4 limbs. Based on these ordinal scales of recruitment and selection complexity, we extrapolated the overall processing complexity of the simple and choice MUL-RT. This method was efficient in reproducing the absolute results we obtained on a ratio scale (ms) and demonstrated that processing complexity in simple RT was mainly governed by the 'recruitment principle' (the more limbs recruited the lower the performance), whereas contributions of recruitment and 'selection principle' (nature of the coordination determines performance) to overall processing complexity were similar in choice RT.


Conflict of interest statement

Competing Interests: The authors have declared that no competing interests exist.

Figures

Figure 1
Figure 1. Study setup. X. Participant setup.
Participants were seated in front of a PC-screen, their forearms resting on a table and their fingers and forefeet on tablets with capacitive proximity switches (in green). Y. Instance of a trial sequence represented on the PC-screen. The right and left upper squares represent the right and left hands whereas the right and left lower squares represent the right and left feet, respectively. (A) Squares are grey when limbs are not in contact with the tablets. (B) They turn white as soon as a limb contacts the corresponding tablet. (C) A trial starts as soon as all limbs are in contact with the tablets. (D) When a square turns blue, this is the stimulus for the participant to release contact with the corresponding tablet as quickly as possible. (E) If the participant lifts the incorrect limb(s), the corresponding square(s) turn(s) red. (F) If he lifts the correct limb(s), the corresponding square(s) turn(s) green. (G) A trial is not validated until the response is fully correct, i.e., without any red square on the screen. (H) As soon as the trial is validated, the green squares turn back to grey. (I) Participants have to reposition all limb segments on the tablets to start a new trial. Z. Coordination modes and clusters. The 15 possible coordination modes (‘a’ to ‘o’) were grouped according to 5 clusters (1L, 2L-HOM, 2L-IPSI, 2L-DIAG, 3L, 4L) based on the number of limbs to be recruited (1, 2, 3 or 4) and the coupling/decoupling interactions involved. (L = limb; DIAG = diagonal; IPSI = ipsilateral; HOM = homologous).
Figure 2
Figure 2. The model of coupling/decoupling interactions.
The quantity of ‘+’ and ‘–’ signs respectively convey the strength of the coupling and decoupling interactions, e.g., ‘++++’ is a very strong coupling whereas ‘−’ is a very weak decoupling.
Figure 3
Figure 3. Study design.
The simple MUL-RT and choice MUL-RT blocks were composed of 5-trial runs×15 coordination modes and 5 trials×15 coordination modes, respectively. Conditions were randomly distributed within both blocks.
Figure 4
Figure 4. Descriptive results.
Mean time ± SD (white text, grey fill) and total number of errors (black text, white fill) for each limb in the simple RT and choice RT conditions as a function of coordination modes. The mean time was computed over free-of-error trials. For a given trial the error was assigned to the first limb that released contact when it should not have. (L = limb; DIAG = diagonal; IPSI = ipsilateral; HOM = homologous).
Figure 5
Figure 5. Coupling of effector-specific networks.
Normalized time as a function of the three 2-limb coordination clusters. Normalized time reflects excitatory interaction, i.e., the shorter the RT the stronger the interaction. Each circle stands for one effector-specific brain network. Black-filled circles illustrate networks associated with moving effectors and white-filled circles represent non-moving effectors. Arrows depict excitatory interaction between moving effectors. (Mean ± SEM; L = limb; DIAG = diagonal; IPSI = ipsilateral; HOM = homologous; * = significant difference).
Figure 6
Figure 6. Decoupling of effector-specific networks. Upper panel.
Adjusted error rates as a function of the six coordination clusters. Adjusted error rates of each coordination cluster reflect a specific failure of inhibitory interactions. Each circle stands for one effector-specific brain network. Black-filled circles illustrate networks associated with moving effectors and white-filled circles represent non-moving effectors. Arrows depict inhibitory interactions between moving and non-moving effectors. As normalized error rates are adjusted to the number of potential error sites here, we illustrated inhibitory interaction toward a single non-moving limb only. Lower panel. Adjusted error rates as a function of the three possible inhibitory failures in 1-limb reaction times. (Mean ± SEM; L = limb; DIAG = diagonal; IPSI = ipsilateral; HOM = homologous; NS = non-significant difference; * = significant difference).
Figure 7
Figure 7. Processing complexity associated with upper vs. lower and right vs. left limbs.
Normalized time performance in upper (black) and lower (white) limbs as a function of body side (right, left) and session (1, 2). (Mean ± SEM; * = significant difference).
Figure 8
Figure 8. Recruitment complexity of coordination clusters.
Absolute time in the simple RT condition as a function of the six coordination clusters. (mean ± SEM; L = limb; DIAG = diagonal; IPSI = ipsilateral; HOM = homologous; NS = non-significant difference; * = significant difference).
Figure 9
Figure 9. Selection complexity of coordination clusters.
X. Normalized time performance (gray columns) as a function of the six coordinations clusters. Y. Normalized error rate as a function of the six coordination clusters in Session 1 (black columns) and 2 (white columns). (Mean ± SEM; L = limb; DIAG = diagonal; IPSI = ipsilateral; HOM = homologous; NS = non-significant difference; * = significant difference).
Figure 10
Figure 10. Weighting of the recruitment and selection principles accounts for overall complexity.
X. Ratio complexity. Overall ratio complexity of the different coordination clusters in simple (left-hand panel) and choice (right-hand panel) MUL-RT is estimated based on the absolute time-duration measures. Y. Overall processing complexity is extrapolated, based on the ordinal scales of recruitment and selection complexity. Overall ordinal complexity (middle bold arrow) is extrapolated from the association of the number (left regular arrow) (3L = 4L>2L>1L) and interaction (right regular arrow) (2L-DIAG>3L>2L-IPSI>1L = 2L-HOM>4L) ordinal complexity. The arrows indicate the direction of increased complexity. Length of the arrows represents the relative contribution (weight) of each principle to the overall complexity of the task. This relative contribution determines the order of the coordination clusters’ overall complexity as indicated by red horizontal bars where dotted lines cross the bold arrow. In simple RTs, the recruitment complexity is more heavily weighted than selection complexity. As a consequence, overall ordinal complexity in the simple RT condition follows the pattern of recruitment complexity. From simple to choice MUL-RT, the contribution/weighting of selection complexity increases relative to recruitment complexity (increased length of the selection complexity but not recruitment complexity arrow). As a result overall complexity in the choice MUL-RT (3L>2L-DIAG>4L = 2L-IPSI>2L-HOM>1L) is no longer solely governed by the recruitment principle but reflects a similar contribution from the recruitment and selection principles (similar length of the arrows). Extrapolated complexity of the different coordination clusters matches the ones observed in the ratio scale for both the simple and choice MUL-RT. Therefore, overall complexity of a given coordination cluster in a given RT condition can be explained by a weighted combination of the recruitment and selection principles. (L = limb; DIAG = diagonal; IPSI = ipsilateral; HOM = homologous; NS = non-significant difference; * = significant difference).

References

    1. Jensen AR (2006) Clocking the mind: mental chronometry and individual differences. Oxford: Elsevier. 287p.
    1. Schmidt RA, Lee TD (2005) Motor control and learning: a behavioral emphasis. Champaign: Human Kinetics. 537 p.
    1. Jensen AR (1993) Why is reaction time correlated with psychometric g? Curr Dir Psychol Sci 2: 53–56.
    1. Donders FC (1969) On the speed of mental processes. Acta Psychol (Amst) 30: 412–431. - PubMed
    1. Philipp AM, Koch I (2011) The role of response modalities in cognitive task representations. Adv Cogn Psychol 7: 31–38. - PMC - PubMed

Publication types

LinkOut - more resources